
Today's Market
by Dr Invest
I've been looking for something to celebrate in market recovery over the past month, and I am disappointed. All of the promised improvements in the U.S. economy have not appeared. Even worse, there is an apparent decline in the U.S. economy that even the Federal Reserve recognizes. Yellen would never say that, but her planned increase in interest rates have been taken off the table. She, of course, reminds us that the Federal Reserve will be reviewing the progress of the economy and could increase interest rates at any time. (wink wink)
History shows that valuations above 23x earnings have tended to denote secular bull market peaks. Conversely, valuations at 7x earnings, or less, have tended to denote secular bull market starting points. This point can be proven simply by looking at the distribution of returns as compared to valuations over time.
From current levels history suggest that returns to investors over the next 10 and 20-years will likely be lower than higher. However, as I said, we can also prove this mathematically as well.
(1+nominal GDP growth)*(normal market cap to GDP ratio / actual market cap to GDP ratio)^(1/10)-1
Therefore, IF we assume that GDP could maintain 4% annualized growth in the future, with no recessions, AND IF current market cap/GDP stays flat at 1.25, AND IF the current dividend yield of roughly 2% remains, we get forward returns of:
(1.04)*(.8/1.25)^(1/10)-1+.02 = 1.5%
So what we learn from John Hussman's formula is that AT BEST, we should be getting a return of 1.5% is every thing remains the same over the next 10 to 20 years.
TRUTH
Truth is hard to come by. On any one day, you will read articles that the economy is surging and that economy is floundering. Truth is what every investor desires. What is the TRUTH?
Below is a chart showing in the BLUE, returns promised by investment software. This is what your investment adviser uses to figure all the money your are going to get from your investments in the years ahead. Charts are always comforting to view, but are based on VARIABLES from past years. Note the word: VARIABLE.... it means things change.
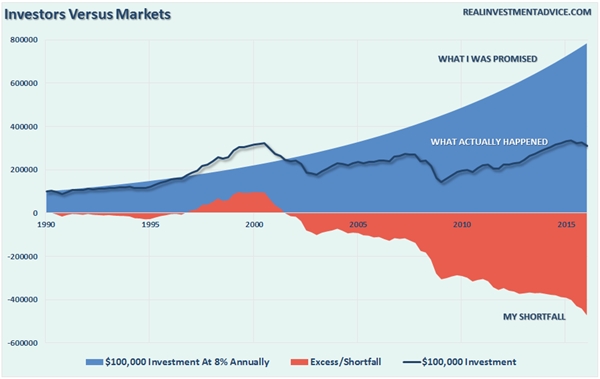
Most investment firms calculate your potential returns based on data from the 1950's. The economy changes and that is even more evident beginning in 2000. When you visit your financial adviser ask him to show you the returns on $10,000 invested in the year 2000 until the present, and you will be shocked.
Overspending, high government and personal debt, defaults, and Central Bank stimulus have all taken their toll on returns. The myth is that the rich are getting richer, while the middle class is slipping into poverty. This idea is largely false when it comes to stocks. Truth!
Look for a moment at the S&P chart below:

The total return certainly looks better, but the real (inflation-adjusted) purchasing power of that $1,000 is currently only 316 dollars above break-even, a real compounded annual return of 1.71%.
So listen, if you are part of the crowd that beats their chest and complains about all the BIG money that rich investors are getting from stocks, think again. The compounded annual return for the buy and hold crowd is barely over the interest currently being paid by banks for a Certificate of Deposit.
I give you permission to go and cry for awhile. Tell the truth and don't perpetuate the myth of large profits, it just isn't happening.
(Note: the above article is for entertainment purposes only and not to be used in any way as investment advice.)
It was an Interesting Article! Thanks for the Information. To know more New Savings Account
ReplyDeleteThank you so much for sharing all this wonderful info with the how-to's!!!! It is so appreciated!!!You can find out more on Online New Account Opening
ReplyDelete