Monday, December 7, 2015

Image result for baby cryingToday's Market
by Dr Invest

Massive confusion continues in the markets with proclamations that our economy is "taking-off" to "collapse is eminent". The truth is that our economy has been on a "quantitative fix" since 2012. No one would argue that the market has continued to rise since 2012, but it is merely smoke and mirrors. When this business cycle completes, you will be worse off than when you began.

There must be some basis for measurable economic growth. Let me explain it this way, "Real economic growth originates from two things, jobs and productivity." You might point out that job growth is rocketing, but it is not! The jobs being recorded are low pay and low hours. Furthermore, more people have dropped out of jobs, so total jobs held in 2015 are less than were held in 2000. Even worse, there are more people on social services in 2015, than in 2000. Our economy is in trouble.

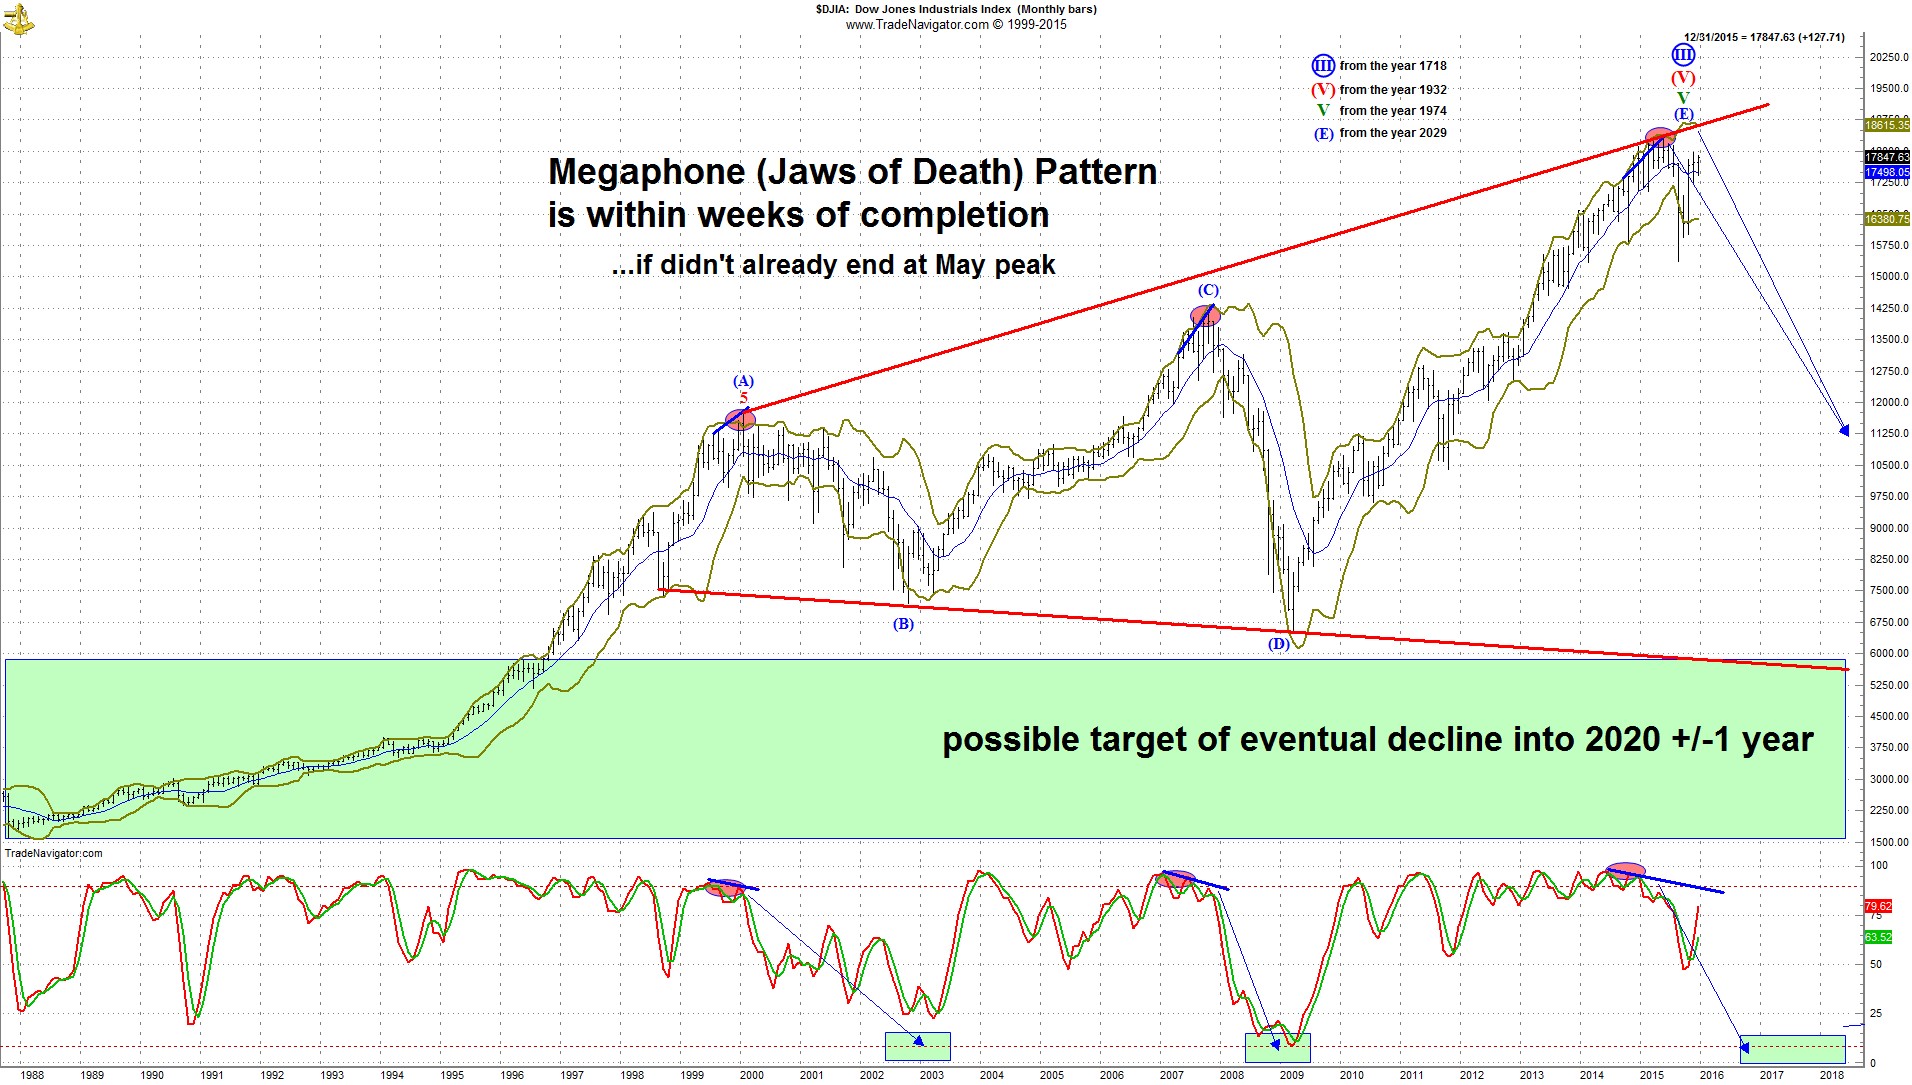
Ken Goldberg points out in his article, "Why the Dow Jones Industrial could begin a 70% decline in the next few Weeks", that fundamentals are pointing to a collapse. Goldberg writes:

There is a rare bull market pattern that, once it ends, is one of the worst formations that can occur. It has two names. Some call it the megaphone pattern, as its shape resembles what many know as the voice amplifier that coaches and referees use to get large groups of people to pay attention.
Those who know its implication for the financial markets refer to it as the Jaws of Death pattern. In fact, both names have meaning for this ominous indicator of egregious crowd bullishness. Its megaphone analogy reminds us that when this pattern appears, investors need to pay attention that the party attitude of recent memory is on it's "last call." The Jaws of Death descriptor is clear. When the pattern ends, the jaws snap shut like those of an alligator chomping down on hapless prey that got too close to the water.
Goldberg tells us that a DOW at 6,000 is within the realm of possibility.  
I agree with his assessment. Though the market has risen dramatically because of stimulus, this rise is not economic. What I mean is that GDP continues at 1.9, when the historical average has been 3.2. We are in a RECESSION because we are not even reaching historical averages for the GDP which is the measure of economic growth. Even the most bullish of economists don't see us reaching the 3.2 average for GDP anytime soon and the most positive words they can find is malaise and stagnant. The are hardly encouraging words
Look at the BOTTOM RED LINE in the graph. That is where we are headed unless there is more Q.E. I can't imagine the FED increasing interest rates, but even if there is a temporary increase in interest rates, I could see them lowered again in 2016 in yet another attempt by the FED to stop a faltering economy. There are still some tools in the FED's toolbox, but you can understand how 0% rates put the FED at a disadvantage. 
There is a belief that one can quickly sell their stocks and get out of the market before they get really hurt. Many of the people who contacted me in October didn't even know that their was a problem until they had lost thousands. I don't believe that there will be another bounce when the market turns down again. The second issues is the rapidity at which the markets can fall. There are two reasons for this. First, is that trading is done by computer algorithms. And second, you need buyers to sell. When algorithms are initiated, markets move with such rapidity that no one is interested in buying your stocks until a bottom is reached. Only the very earliest sellers are successful keeping their profits. Those early sellers typically have T-1 internet access and dedicated lines to brokerages so the success of their trades are measured in milliseconds. The average Joe will not have that kind of access, even if you have your stop-sells in place. 
SO WHAT CAN I DO
Recognize that we are at the end of a business cycle. It might be six weeks or six months, but this business cycle is over. Brokers, financial advisers, the Federal Reserve, the White House, bankers, wall street.... all of them have an interest in keeping the chump (investor) in the game. Wisdom would be to get out of the game before you get hurt. 
One individual asked, "Do I need to get out of my bonds?". I found out that he had purchased the bonds years ago returning 5% a year until maturity. When you can only get .82% interest, 5% interest seems like a huge return. Get rid of the stocks that are going to injure you. 
What about taxes? Taxes are kind of a relative thing, but are regularly used by financial advisers to threaten their clients. Again, every situation is different and requires some analysis, but losing 70% of your stocks value seems much worse than paying 20% capital gains. Furthermore, you will have a NEW TAX BASIS when you buy back into the market. 
First scenario: XYZ Stock cost you $100 in 2008 and has doubled in value to $200 in 2015. The market collapses 70% leaving the value of your XYZ Stock at $60. 
Second scenario: You purchased XYZ Stock at $100 in 2008 and it doubles in value to $200 in 2015. You sell XYZ Stock at $200. Your COST BASIS is $100, and you pay 20% in capital gains. You now have a total, after taxes, of $180. 
Which of these scenarios left you in a better position at the end of the business cycle? Let me extend these scenarios a bit further. As the market moves out of a decline in 2018, you purchase ABC Stock.
First scenario: ABC Stock is purchased with the $60 you had left over from your losses in 2016, but ABC Stock rises 100% and the value of your ABC Stock is now $120.
Second scenario: ABC Stock is purchased with the $180 you had after selling XYZ Stock and paying capital gains taxes in 2016. ABC Stock rises 100% and the value of your ABC Stock is now $360.
Which of these scenarios left you in a better position?
Yeah but what if I bought XYZ Stock at $1 and it was worth $200 in 2015, and now if I sell it I will have to pay 20% capital gains taxes on $199. Listen, even then you're only paying $40 in capital gains, leaving you with $160.  But even then, that is better than just having only $60 left over after the market falling 70%. (which was the original argument)
The brokers, financial advisers, and banking system want to put you into their system and hold you there. A Buy and Hold mentality ends in entrapment by the system. Do your own mathematics and you will likely see that things are not as dark as your financial adviser has presented it. 
(Note: the above information is for entertainment purposes only and not to be used in anyway as investment advice.)


Friday, November 6, 2015

Today's Market
by Dr Invest

I have never heard so much enthusiasm for stocks after the market took such a beating only two months ago. Once again smooth throated brokers and advisers are harping their products. The promise is that the economy is on solid ground and can go no where but up. They admittedly accept that fundamentals are pointed downward, but that such facts are only temporary anomalies and that soon positive fundamentals will support the rapid rise in the stock market.

What they don't seem to realize is that the temporary rise in the stock market comes from overly enthusiastic speculators and that stocks remain over-valued. John Bogle, the founder of Vanguard has always been in love with the market and built an industry around the idea of BUY AND HOLD. Listen to what he recently said:

Investors can look forward to stock-market gains of 4 percent a year for the next decade.

He says that investors will be unwilling to overpay for earnings and dividends from publicly traded companies, making gains hard to come by. By comparison, the S&P 500 has tripled in value since bottoming in March 2009 as the U.S. struggled to recover from the worst recession in 80 years.

In an interview with Morningstar’s personal finance editor Christine Benz, he says his assumption is based on a 2 percent dividend yield for the S&P 500 and earnings growth of 5 percent.

Cutting into that 7 percent return will be a 3 percent loss from “multiple compression,” meaning investors will buy stocks at a lower price-to-earnings ratio. The market’s P/E multiple is likely to fall to a longer-term average of 15 times from about 20 now.

“We've got a 4 percent return for stocks — maybe a little bearish, but we just don't know — and a 3 percent return for bonds. That's a 3.5 percent return on a balanced 50-50 portfolio,” Bogle says. Unfortunately, investors need to consider fund-management fees that will also cut into returns.

Despite the subdued forecast, Bogle says, “Invest we must,” because inflationary forces will eat away at savings.

“The biggest lesson is that investors must save more to meet their goals. The markets are unlikely to do the heavy lifting that they’ve done in the past with prodigious returns,” he writes. “As for pensions, which continue to plug the customary 7.5 percent returns in their forecasts for balanced allocations, investors should disregard their forecasts completely.”


In this new forecast, Bogle joins the ranks of notable value investors and market observers Jeremy Grantham, Robert Arnott, and Robert Shiller , whose dim views of stock valuations and future returns are well-documented.

Bogle’s new forecast amounts to a tacit admission that the “equity risk premium” (the supposed amount of excess return that stock are supposed to deliver over bonds) isn’t static. Rather, it can change over time. Stocks are not always guaranteed to deliver, say, 10% annualized returns on a nominal basis, even over decade-long periods.

Academic studies have shown that the Shiller PE has greater statistical validity than a conventional PE at forecasting future returns. One year’s worth of earnings can be misleading. Nevertheless, Bogle and the value mavens are now in agreement about likely future returns.

Balanced portfolios under siege

On bonds, Bogle thinks investors can squeeze 3% from a fixed-income portfolio with an average maturity that’s a little longer than 10 years and ia somewhat heavy in corporate bonds. The 10-year Treasury TMUBMUSD10Y, +4.08% currently yields slightly more than 2%.

Overall, the implications for a standard balanced portfolio are grim.

Bogle predicts that a balanced portfolio (roughly half in stocks and half in bonds) should return around 3.5% for the next decade. Adjusted for inflation or in “real” terms, Bogle thinks a balanced portfolio will return 1.5%, barely increasing purchasing power.

Fees may destroy paltry returns

Bogle then asserted that fund fees of, say, 1%, will destroy much of that balanced portfolio’s real return. Combined with advisor fees of 0.50% (a conservative number), investors may be left with nothing after adjusting for inflation.

Moreover, taxes and well-documented investor bad behavior (buying funds at high points and selling them lower) will likely erode investor returns further.

Benz raised the question of whether investors should invest at all given this forecast, and Bogle said, “Invest we must.” The reason for that is cash is yielding virtually nothing, which means it’s producing a negative return in real or inflation-adjusted returns.

Given Bogle’s grim view, however, it isn’t clear why investing really is better since it can also produce negative real returns.

Only yield is certain

Bogle also stressed that the only certain part of his stock forecast is the starting dividend yield of stocks. Earnings growth and multiple changes are always guesses, and he could be wrong about both.

Both advisers and investors can plug other numbers in for earnings growth and multiple changes. Still, they should be careful not to veer far from historical precedent. For example 10% earnings growth would be “beyond precedent.”

Save more and ignore pension forecasts

Investors should take serious note of Bogle’s forecast.

The biggest lesson is that investors must save more to meet their goals. The markets are unlikely to do the heavy lifting that they’ve done in the past with prodigious returns.

As for pensions, which continue to plug the customary 7.5% returns in their forecasts for balanced allocations, investors should disregard their forecasts completely.


Amongst the enthusiastic voices declaring a "new age" has come of continued and everlasting market conditions due to a vigilant central bank are long-time perma-bulls warning that the party is over. Louise Yamada, a highly regarded technical analyst who heads Louise Yamada Technical Research Advisors, contends that distress had been building throughout the third quarter. In the September edition of her monthly newsletter, Technical Perspectives, she pointed to data from the Investment Company Institute, a fund industry group, showing that owners of stock and bond mutual funds alike made net withdrawals in July and the first three weeks of August.

"Their observation is that usually stock withdrawals move into bond funds," Yamada wrote, "but withdrawals from both [are] a sign of nervous investors. This pattern has not been seen since the fall of 2008, a statistic worth noting."

Morningstar found six months over the last decade when investors had net withdrawals from stock mutual funds and ETFs combined and from bond funds, too, with August being the sixth. Two of the other five, August 2013 and June 2006, coincided with minor blips in long bull markets.

The other three -- June 2015, August 2011 and October 2008, the latter period being the one Yamada alluded to -- occurred just before or in the middle of corrections or bear markets. Anyone who saw fund investors' none-of-the-above attitude as a contrarian "buy" signal for stocks turned out to have jumped in too early.

Buyers who jumped into stocks at the start of October enjoyed an excellent month that could be the start of a long rally. But if the history of those three months repeats, it could turn out to be the calm between two storms.

Concluding Thoughts

We may see one of the greatest rallies in the U.S. ever seen since the beginning of this nation; although, a rally is not very likely in the current economic environment. Perma-bears have been giving a warning since 2012 when Q.E. began along with bond purchases by the FED. But now many perma-bulls are warning that valuations are too rich and fundamentals are too weak. 

I mentioned that six weeks ago some of my friends were very worried. They believed that a the bull market had abruptly ended. I encouraged them by suggesting a "dead-cat bounce" was in order and to hold on until the market rebounded, then take profits. 

I now thing that the fear has waned and the bears have been converted to bulls again. The next decline will not be so kind. I suspect that a HEAD AND SHOULDERS PATTERN will be unfolding over the next few months. Best guess is a head forming into January with the right shoulder completing in March or April of 2016. 

If you don't know what I am talking about, do a WIKI search for  HEAD AND SHOULDERS PATTERN. Keep your eye on the S&P 500 and when you begin to seen a slow decline in January, run, don't walk to your nearest broker. We could see a decline that was even worse than in 2008. 

(note: the above information is for entertainment purposes only and in no way should be used as investment advice.)

Tuesday, November 3, 2015


Today's Market
by Dr Invest

How high can you go? What has changed? What fundamentals are you looking at that shows a new strong economic environment? In 2012, the economy began to falter and thanks to Bernanke's bond buying and quantitative easing, we escaped the hard cold truth that our economy was failing. It has never stopped failing since 2012. We have just kicked the can down the road by borrowing and stimulating. Fundamentally, nothing has changed.

There is the promise that our economy is soaring but a careful look at the fundamentals show something very troubling. Many wall street brokers continue their mantra, "Keep that balanced portfolio and hold-on, things will only get better." This encouragement comes in the face of a business cycle that is already long-of-tooth and likely to collapse at any moment. Furthermore, the FED has pumped up the economy, increasing our debt and limiting future potential growth. So let's look at some of the fundamentals that your financial adviser is not showing you.

recession1

Durable Goods has fallen - 5.3% in the past year. This is a precursor of a recession. Look at 1990, 2000, 2009, and note 2012 that was only saved by Quantitative Easing.


recession2

The ISM Manufacturing PMI has declined -13.5% over the past year. Is this a precursor to recession?- note the dotted red lines representing recessionary periods. Again, look at 2012, where we were saved by QE. Now, in 2015, the decline is below that of 2012 when Bernanke acted to save us slipping into recession. This slide is a precursor of recession.

recession3

Capacity Utilization has declined -1.9% over the past year. We are interested in the yellow line. Note: Capacity Utilization touched zero in 2012 and would have advanced further excepting QE. Over the past year, a strong decline has pushed CU below zero into the negative envelope, a strong sign of potential recession.

recession5

The GDP chart is the most troubling of all. There has been a steady decline in the GDP with no real expansion occurring since 1982. Think of GDP like an unwinding music box, with the music getting slower and slower; likewise, since 2000, our economy has slowed to a crawl. Even looking from 2009 until now, the GDP has continued its decline with the GDP likely falling to 1.8% in 2015.

Closing Thoughts

Can the economy be robust and vibrant at a GDP of 1.8%? No one I know would think so. Dr. Shiller is warning that stocks are over valued in the U.S. market. Dr. Faber is warning that stocks are rising on only a narrow few stocks that are reporting profits, while the majority are reporting missed projections; Bill Gross and George Soros both warn of a waning economy and a recessionary environment. Still, the S&P, DOW, and Nasdeq continue their rise while investors have become blind to the impending risks.

A month ago, when the investors were smarting from a downturn in the market, I comforted them and reassured them that there would be a bounce. I warned, you will see a bounce but don't interpret it as a rebounding economy. I fear my advice was not taken. Relieved that the market was returning to an all-time high, many have decided to stay-in and ride out the ups and downs. They will see again, the sudden and unnerving fall that comes at the end of a business cycle, only this time there will not be a bounce.

(note: the above information is for entertainment purposes only and not to be used in anyway as investment advice.)


Thursday, October 1, 2015

Today's Market
by Dr Invest

No, there is really nothing new to report. Everything we are seeing is, well, predictable. Look, go to GUARDIAN and look at this link: Guardian Indicator   Here are a few things they mention:

MARKET SECTORS


As many of you know, I warned of a market collapse in 2012. Only quantitative easing stopped the plummet. Trillions kept the market afloat, but was the same as money printing. New reports show that QE did little in improving the economy, but elevated the price of stocks. 

Despite glowing reports by the Federal Reserve of economic strength and president Obama's claim that his policies had saved the economy, data seems to show something a bit different. as early as the end of 2013, a number of sectors had already began to decline. It is just because the BUBBLE had risen so high from QE, that the effects of a declining economy had not yet become a reality. Surely the FED and the White House had this same data. My opinion is that the FED made an attempt to raise interest rates, so it would have more wiggle room for the coming reality of an economic decline. 

Christine Lagarde, IMF managing director, gave warning that emerging nations were facing a fifth consecutive year of slowing growth, adding that an increase in US interest rates could exacerbate conditions in some leading economies. (International Monetary Fund)

Conclusion

Clearly, the market is trending lower and set strongly into the market by 2015. The problem was there before 2015, but the economy had distance to fall before we felt it. Now, investors are faced with major losses, after major gains. 

Major risks did pay-off in major gains. But when you see $25,000, $50,000, or $100,000 losses in a month for some individual investors, it becomes a very threatening event. When these events occur once, followed by a bounce after the initial loss, there is hope that new gains will return. But after two events and the mounting losses almost doubling, any investor is reluctant to continue in the market. 

AAII is showing a rising negativity among members who believe the market is now trending downward. This simply means that more and more individual investors are reluctant to continue in the market. This trend will likely magnify the market trend downward.

We may see the market trend higher, but even the most devoted bears are expecting the S&P 500 to advance no further than 2000. My feeling is that we will see something less than 2000 and maybe with a great deal of volatility.

(note: the above article is for entertainment purposes only and not to be used as investment advice.)

Wednesday, September 30, 2015

Today's Market
by Dr Invest

There are really no new surprises in the market. The breath taking fall of 2.5% is a continuation of a declining market moving to lower lows. 2015 began with excuses that weather had temporarily caused a decline in the market, then there was "oil gate" and the sudden decline in oil prices, and later other excuses were made for a declining market in 2015 such as the Chinese economy. Still, economists and analysts believed that 2015 would be the defining year in which the economy would "take off" and GDP would reach 3% with the S&P growing 10% to 12%. At this late season of 2015, most of these perma-bulls are readjusting their projections, only because to maintain them would be outright embarrassing. Let look at some of these new projections.

Goldman Sachs

After stock prices slumped in late August, the analysts at Goldman Sachs were quick to argue that we could see a rapid snap back in prices as we did in 1998But in a new note to clients, they've changed their tone. "We have lowered both our S&P 500 earnings estimates and price targets," Goldman's David Kostin writes. "The impetus for these reductions is that our models now incorporate a slower pace of economic activity in the US and China and a lower oil price than we had been previously assuming." Kostin now sees the S&P 500 ending the year at 2,000, down from his previous target of 2,100.


Janus Capital

In a tweet on Tuesday morning, Janus Capital's Bill Gross said: "Stock market refrain from a few months ago: "Where else are you gonna put your money?" LOL ... Ever considered cash?" Put another way, Gross is laughing at people who invested in the stock market because there was nothing else to invest in. Folks who have been reading Gross' investment updates over the past year or so most likely know that Gross would prefer holding cash to being invested in the stock market — or almost anything else. Early in September, Gross' monthly missive basically said everything sucked.

Gross wrote:

Global fiscal (and monetary) policy is not now constructive nor growth enhancing, nor is it likely to be. If that be the case, then equity market capital gains and future returns are likely to be limited if not downward sloping. High quality global bond markets offer little reward relative to durational risk. Private equity and hedge related returns cannot long prosper if global growth remains anemic. Cash or better yet "near cash" such as 1-2 year corporate bonds are my best idea of appropriate risks/reward investments. The reward is not much, but as Will Rogers once said during the Great Depression – "I'm not so much concerned about the return on my money as the return of my money."
Early Tuesday, stocks were falling after getting crushed on Monday.

Merrill Lynch

The fourth quarter looks like it will be bumpy, and investors shouldn't plan on taking on extra risk in the final months of 2015, Bank of America Merrill Lynch's Christopher Wolfe said Wednesday. Three big fears are looming for the chief investment officer: a corporate earnings recession, uncertainty swirling around worldwide monetary policy and downward revisions to corporate sales and guidance for the remainder of 2015 and likely part of 2016.

RCB

Another top Wall Street bull has lowered his stock market forecast for the year. At the end of last year, Golub's forecast for the S&P 500 for 2015 was 2,325, "consistent with 12% potential upside". Of the strategists followed by Business Insider, Golub was tied for most bullish forecast. But in a note to clients on Monday, Golub lowered his forecast to 2,100, which would see the S&P 500 gain just 2% for the year. The benchmark index opened at 1,911.75 on Monday; it would need a roughly 10% rally to hit RBC's forecast.


Barbara Kolmeyer

Welcome to the worst day of the year for investors, though you wouldn’t know it by looking at stock futures this morning. Thank the portfolio window-dressers or bouncy dead cats, but the market looks set to fly. Anyway, that gloomy prognosis for the day fits nicely with the disastrous end to the quarter we’re headed for, set to finish with 8% to 9% losses for the big U.S. indexes. The quarter has delivered the biggest point declines for the Dow industrialsDJIA, +1.24% and the Nasdaq Composite COMP, +1.70% since the end of 2008, and the biggest for the S&P 500 since 2011.

Wall Street, though, is hoping to brush the quarter under the rug. A Reuters poll of 40 strategists found that most think the worst is over for stocks. (Less bullish, perhaps, is Goldman Sachs, which cut its S&P 500 target to 2,000 yesterday, though its strategist David Kostin cushioned that with a “flat-is-the-new-up” mantra.) Those strategists polled think the S&P will end up at 2,094 by the end of 2015 — a gain of 2% for the year, but 7% below where they thought it would be when asked a few months ago.

If these market magicians know anything, it’s that stocks needs a catalyst to go up. They can no longer count on the Fed, as one CIO quoted by Reuters rightly pointed out. (Note that Goldman also called for more QE.) This column discussed yesterday how that catalyst will be earnings, and companies themselves will need to put up or shut up to keep the bull from dying. A 2% gain would keep the bull market going, but not by much.

Figuring out a year-end target for the S&P 500 is clearly a guessing game. And some really aren’t buying any sort of stock-market optimism at all. Take our call of the day, which warns that Wall Street is pulling the wool over the peasant’s eyes right now.

Carl Icahn

Icahn calls for taxes to be lowered for corporations and raised for hedge fund managers. He also reiterates his previous warning that interest rates hovering close to zero are creating investment bubbles in real estate, art, corporate earnings and high-yield bonds.

"The middle-class investor has nowhere to go with their money but into the (stock) market, or even more concerning, high-yield bonds, which are very risky," Icahn said in the video, which is posted on his website CarlIcahn.com.

Conclusion

Economic Cycles Research Institute defines more realistically what is happening. Here is what they say: What most may not realize is that U.S. economic growth has actually been falling since early 2015. Year-over-year (yoy) growth in ECRI’s U.S. Coincident Index, a broad measure of economic activity that includes GDP, employment, income and sales, has fallen to a one-and-a-half-year low.

Yet, for months, the consensus has continued to believe in the “second-half rebound” following the “weather-related” first-quarter weakness. That narrative is finally falling apart, with the dawning realization that the reality is 180 degrees from that popular view. 

In a recent interview with The Wall Street Journal, New York Fed President Bill Dudley finally acknowledged that the "second half of the year will probably be a little bit weaker than the first half of the year." Some Wall Street houses are also starting to recognize that reality. 

After all, as we pointed out over the summer, "a service sector slowdown has already joined the manufacturing slowdown that started last fall, and so the slowdown in overall growth is likely to intensify in the coming months. As such, hopes for a 'second-half rebound' are likely to be dashed."
 
The good news is that, notwithstanding the continued slowdown, ECRI’s indexes are not yet pointing to recession.

My View

Market swings are made up of two things, data and emotion. The data tells us that there is a slow down, but we are not in a recession. Emotion, on the other hand, is heightened because we are at the end of a bear market, the losses of 2008 are still fresh on investor's minds, and you can smell the fear in investors. 

Many investors have seen QE dry up and now have to face the reality of rising interest rates and uncertainty in the market. When these sell-offs occur in a weak and tepid market, people want to take their profit. The use of Stop-sells by individual traders and the execution of trades during a market sell-off brings the brokerage houses to almost a crawl. Though we haven't entered a recession, it feels like a recession and is likely to continue that course in the months to come.

Protecting Yourself

Return to the fundamentals of investing you have learned. If you buy a security, buy it knowing how much you are willing to lose (for example 6%), if the security goes down below 6%, sell it immediately.  If the security goes up 10%, move your stop-sell to 6% below the current price. If it moves down 6%, sell it immediately and take your 4% PROFIT.  

Having hard fast rules protects you from your emotion. It is easy to say to yourself, "I know I have a big loss here, but it will come back." Some years ago, I bought into GE (general electric), when it fell, I sold half of my position, but kept GE because I was sure that it would rebound..... it didn't! By the time I sold GE, I had lost all my previous profit. Don't out guess your RULES. Live by your RULES and you won't get hurt.

(Note: the above information is for entertainment purposes only and not to be used as investment advice.)

Thursday, September 24, 2015

Today's Market
by Dr Invest

What can I report? I know! Nothing has changed. What you saw in 2012 is what you see in 2015. Your saying, "O yeah, my portfolio has grown since 2012!" You just think your portfolio has grown and that is the problem.

Recently Marc Faber explained, "Your dollar doesn't buy as much as it did ten years ago! Median income in the U.S. has decreased from $58,000 annually to $52,000 annually." Faber says, "Because of QE and bond buying, the dollar has been devalued so it takes more dollars to buy the same things you bought ten years ago. The only reason the dollar appears strong is because other currencies are so weak, but when you compare the actual value of the dollar, relative to the U.S. dollar of ten years ago, it takes more dollars to purchase the same things."

We can applaud the fact that the price of oil is down and so we are rewarded at the pump. But food prices are dramatically up, the cost of insurance is dramatically up, the cost of healthcare is dramatically up, the cost of housing is dramatically up. In our area a two bed room duplex rose from $800 to now $1,100 per month. That is almost a 38% increase in rent alone, and many families work two part-time jobs because a full 40 hour a week job can no longer be acquired. Thanks to Obamacare, businesses no longer hire full-time employees so they are not forced into the government healthcare system. There is discussion about forcing employers to pay a higher minimum wage, but this will turn out badly as well. Employers will just get rid of non skilled workers and the unemployed with grow.

More good news in the strong economy we now have. Catepillar is cutting 10,0000 jobs, just like IBM, JCPenny, Sears, HP, and many other corporations. But don't forget, our strong economy will quickly help these unemployed find jobs. (If you are from another country, I am joking. Our economy is pitifully weak and the fundamentals of our economy has been sinking over the past year.)

In the S&P 500 chart below, you will see the long-term patterns going back to 1970. The "strategic number" is an algorithmic measure comprised of multiple factors which measure risk. When it is close to 100, risk is very high. When it is close to 0, risk is very low. In between, risk is about normal, and trend following can be employed. The "strategic risk range" shows the rough range that the market is likely to be in during the intermediate term.


This is a chart used by QUANTS to determine the trend of the market. The S&P is already well into a downtrend.

Experimental Monetizing

No, I've never heard of lowering interest rates below 0%, but it has already been done in Denmark; other central banks are already discussing the method and it has been discussed by our own Federal Reserve. This exactly what Peter Schiff has been saying. He claims that Yellen threatened to raise interest rates to make it appear that the economy was stronger than it really was, all the time knowing that she would remain at the 0% interest rate. Now there are suggestions to implement negative interest rates just in case there is a truly horrific recession.

Today, Yellen said that her intent was to raise interest rates this year, but would be ready if the market turned down.

Conclusion

As I began, nothing has changed. The economy remains weak and declining. This typically results in a continued downtrend. Expect six months before we begin to see unemployment returning and the admission that we are in a recession, but for now we should see lower lows as the market slips further into a recession.

(note: the above information is for entertainment purposes only and should not be used as investment advice.)

Saturday, September 12, 2015

Today's Market
by Dr Invest

There is nothing predictable in the stock market because the game is rigged. The market went into a recession in 2012. Copper declined, while stocks climbed. No longer was copper correlated to the stock market, and was surest sign that the fundamentals of the market were declining. There was a Head and Shoulders Pattern in the S&P 500, but rather than a decline, the QE by Bernanke kept stocks rising. This is what we would later learn was called the FED's WEALTH EFFECT. It was as if the economy was on LIFE SUPPORT. The FED was reassuring the investor that they would stand behind the stock market guaranteeing future gains and job growth.

After seven years of government stimulus, studies have shown that the only thing the government has successfully done was to go deeper into debt and overvalue stocks. This is a course they may well continue, considering that to remove life support from the economy would surely return it to a down trend. The idea of ESCAPE VELOCITY has been bantered around in the study of economics and both the FED and OBAMA has proclaimed that our economy is STRONGLY RESPONDING to the interventions of the FED.

 It is certain that in 2015 our economy has deteriorated. The FED and WALL STREET have said the deterioration was due to weather and later in 2015 proclaimed that the deterioration was due to China, but economic indicators seem to point to continued deterioration through out 2015. Now the question remains whether the FED will raise the interest rate 1/4 % or continue the current trend of 0% interest. We will know by Thursday.

Below is a chart showing the S&P500. Marked in red is the trend of the market. You will see a technical indicator showing what a BEARISH PENNANT looks like. When comparing that example with the actual chart, it looks identical. The expectation is that a down trend could occur at any moment.  

I really don't need to say more. Protect your investment. Expect that at any moment the economy could deteriorate and enter a steep decline. The technical signs don't typically lie, but who knows what further things the FED might do to stave off an almost certain decline.


Note:The above article is for entertainment purposes and not to be used in any way as financial advice.

Monday, August 24, 2015


Today's Market
by Dr Invest

Ouch! Ouch! Ouch! say's Wile Coyote. Known for his scheming which always results in the ultimate fail, he races to the next opportunity to fail once again.  This circus of comedy is unfolding right now in our stock market. Here is some of the genius advice being offered by wall street and the news media:

Don't panic... uh, don't panic.... remember that you are a long-term investor. Just stay where you are. The Federal Reserve has been able to establish stable growth after spending FOUR TRILLION DOLLARS and you can trust that they will spend four trillion more to insure that your investment is safe. (This is Wile Coyote kind of thinking!)

Here are some actual quotes:

Still, despite the grim scene across global equity markets, many market participants see opportunities for those willing to ride out the storm.

Peter Kenny, chief market strategist at Clearpool Group, agreed as well, saying in a letter to clients Monday the he remains "positive" on U.S. equities overall.

El-Erian echoed that sentiment, noting, "this sharp downturn will eventually create interesting opportunities for investors.
 
(Another Wile Coyote misquote by the news media to make the sell-off seem insignificant.)

When El-Erian was asked about the falling market today he said: "the selloff will continue until one of two things happen: emerging markets put in place a policy circuit breaker or prices fall low enough to bring buyers back. How low? Low enough means a lot lower than here because they've been inflated well beyond fundamentals by central bank policies, so in order to bring people back in you've got to overshoot the fundamentals on the down side to induce people back in. We are still well above what would be warranted by fundamentals. There has been this enormous faith in central banks, and that faith in central banks means we have borrowed returns and growth from the future, hoping that central banks will be able to hand off to higher growth. That has not happened."

What I am Trying to Prove

The news media and wall street brokers are telling you what you want to hear. They are slicing and dicing the information and providing the private investors with pieces of information which would make it appear that great investment opportunities are ahead. It is true that great investment opportunities are ahead and that a downturn will create interesting investment opportunities, but that is after your portfolio has lost 50%.

Today is not a Buying Opportunity

Traditionally, we see a bounce after a market sell-off, but there is nothing "traditional" about the current stock market. As I have said previously, the market has been an artificial market since 2012 when Quantitative Easing began. What seems as business as usual is actually underpinned by the Federal Reserve. The four trillion in stimulus simply makes it appear that our economy is prospering. The sad part is that everyone knows that the economy is weak, but continue to sell investments to private investors, knowing that private investors are likely to experience significant losses. 

Brett Arends writes:

Don’t be surprised if stock markets stabilize or bounce back in the next couple of days. Markets are due at least a short-term rally after last week’s dramatic plunge. This usually happens after a sell-off, no matter what the next big move is going to be. It doesn’t mean anything.

But anyone who automatically assumes this is another easy “buying opportunity” is talking nonsense.

For the past couple of years, Wall Street’s perma-bulls have had it their way. They’ve been gloating openly as stocks went up and up and up, seemingly without pause.

It got to the point that those warning about valuations and danger signs had been mocked into silence — or were simply ignored.

Not now.

I don’t mean to be alarmist or to induce panic, but someone needs to tell the public that there is a plausible scenario in which the U.S. stock market now collapses by another 70% until the Dow Jones Industrial Average falls to about 5,000. The index tumbled more than 3% to 16,460 on Friday and over 1,000 points in early trading Monday.

Dow 5,000? Really?

For 30 years, stock prices have been increasingly boosted by financial factors: collapsing interest rates and Federal Reserve manipulation, culminating most recently in ‘quantitative easing.’

I’m not predicting that will happen, but contrary to what the bulls tell you, it cannot be completely ruled out. And even if that ranks as an outlier and a worst-case scenario, there are other, more likely scenarios where the Dow falls to somewhere between 10,000 and 12,000.

In other words, although this might be a buying opportunity, a serious reading of history suggests this sell-off might also be the beginning.

Let me say on the record that I am not joining the perma-bears or extreme doom-mongers. I am simply pointing out that the perma-bulls have taken their own arguments way too far. The stock market is not doomed to collapse to oblivion, as some hysterics keep claiming. But it is not certain to keep going up by 10% a year, either. All those claiming that every sell-off is a buying opportunity, and that stocks “always outperform,” are lying to you.

A true understanding of stock market history shows that Wall Street in the past has moved in long, long swings upwards and downwards, often taking years or even a generation or two. There is a great deal of evidence suggesting that the upward move that began in 1982 is one of them — and that the downward move that first began in 2000 has not ended.Read: Meet the market timer who said things would get ‘ugly’

As stock market historian Russell Napier points out in his book “Anatomy of the Bear,” on five occasions in the past 100 years — in 1921, 1932, 1949, 1974 and 1982 — those big downward moves have not ended until share valuations have fallen to just 30% of the replacement cost of company assets. That’s using a powerful, if little-known, economic metric known as Tobin’s q.

And, to cut to the chase, if Wall Street stocks followed the same path today, that would take the Dow down to about 5,000, and the S&P 500 Index all the way down to around 600. (The S&P 500 slumped more than 3% to 1,971 on Friday, extending the drop as much as 5.3% on Monday.)

Yikes.

The “q” is a valuation that they don’t even mention in the training manuals for the official “financial planner” and financial-analyst exams. Your money manager has probably never heard of it. Or, if he has, he probably ranks it with astrology and the mystic rantings of Nostradamus.

But the “q” happens to have by far the most successful long-term track record of any stock market indicator.

It’s been better than the price-to-earnings ratio or quarterly earnings forecasts or economic growth rates or long-term interest rates or Federal Reserve minutes.

Independent analysts — such as professor Stephen Wright at London University and Andrew Smithers at Smithers & Co., a financial consultancy in London — have tracked it back over 100 years.

And in the past there has been no better guide for the long-term investor. It’s been even better than the cyclically adjusted price-to-earnings measure, also known as the “Shiller PE” after Yale finance professor Robert Shiller (which also, incidentally, suggests U.S. stocks could plunge a long way from here).

The “q” looks at the net asset values of public companies and adjusts them for inflation. It makes some intuitive sense. Why would Widget Inc. be valued at $1 billion on the stock market if you could start the company from scratch for a lot less?

Right now, according to data from the U.S. Federal Reserve, the reading on the “q” is about 100%. (It was 106% at the last reading, on March 1, but the S&P 500 has fallen about 10% since then.)

Since World War II, the average “q” reading has been about 70%. So if Wall Street tumbled just to its modern average valuation, that would take the Dow Jones Industrial Average down to about 12,000.See: When the stock market last crashed, these sectors fared best

If we just look at the period 1949 to 1994 — in other words, before the gigantic, off-the-charts boom of the late 1990s — the historic average “q” reading for stocks was 57%. If the market falls to those levels, that would take the Dow to about 9,500.

And if the market fell to its historic bear market lows, namely 30% or so, that would mean a Dow of about 5,000.

Why might such a scenario happen? It’s not just about China, or Greece, or slowing earnings, or the “death cross” on Apple’s stock. It would be because, for the past 30 years, Wall Street stock prices have been increasingly boosted by financial factors: collapsing interest rates and Federal Reserve manipulation, culminating most recently in “quantitative easing.” But at some point, that game has to come to an end. When it does, it is possible — not certain, but possible — that valuation metrics could unwind all the way back down again.

Past performance, as they say on Wall Street, is no guarantee of future results. And that means there is absolutely no guarantee that share prices in the future will follow a similar path to the one seen in 1921, 1932, 1949, 1974 or 1982. I would consider that to be very much the outer range of possibilities.

The real reason to be worried right now isn’t that these scenarios are guaranteed or even likely. It’s that 99% of the people managing America’s money, probably including yours, assume that they are completely impossible. And no, they aren’t. Have you factored that into your plans?

Closing Thoughts

I would expect a head and shoulders signal to develop, but this is not always the case. I am thinking that a regular pattern of entry into a recession might be skewed by the Quantitative Easing by the Federal Reserve. But after careful examination of the varied chart patterns, I can't honestly recognize a pattern that fits. I don't know what I am looking at, and that makes me very uneasy. 

I don't know that this is the BIG ONE or the collapse of the economy as we know it. But a significant downtrend has developed. I think we will find a new bottom where consolidation will start again, but could continue to lower lows. If you  are not invested in the market, don't start investing now. Wait for a month or two and see where the market is at that time.

(Note: the above information is for entertainment purposes only and is not to be used in anyway as investment advice.)


Tuesday, August 11, 2015

Today's Market
by Dr Invest

A quick look at bloomberg.com leads one to believe that the economy has never been better. The FED is projecting a rousing and robust economic future, and the bevy of financial advisers and analysts are firmly committed to investing in a stock market that they claim is undervalued. One analyst reminded the viewers that you can never trust PE as a measurement of the value of a stock. Another analyst assured the viewers that BONDS would not move lower and would remain a great buy as deflation kept the price of oil low and no major changes in the interest rate would occur.

STAYING OUT OF THE MARKET

I asked a few friends about their view and whether now was a good time for them to invest. The unanimous response was "I'm staying out of the market for now!"  This is no surprise because in
spite of stock prices moving higher and higher, participation in the market is moving lower and lower.


This chart demonstrates that there is a declining VOLUME with rising PRICES in the S&P 500. Simply said, "Fewer people are participating in the stock market even though there are rising prices". This is because people generally are not fooled by the hype and are unwilling to participate in higher risks for financial losses. Those in the market are enjoying some great returns, but will suffer tremendous losses when a down turn finally hits.

INSTITUTIONAL INVESTORS IN REAL ESTATE

Calls that unemployment is at an all-time low and that our economy is finally responding in a robust way to the brilliant actions of the FED has created the belief that things are returning to normal. Black Rock, after the collapse of the housing bubble, began to purchase distressed properties across the U.S. As the price of housing increases, Black Rock will, along with other institutional companies, begin to divest their selves of this real estate.

The problem is that their is a "NEW NORMAL". For most people, their one and only real investment has been their home; now, retiring and needing income, there is a flood of real estate coming onto the market. Individuals and institutional investors will be seeking to sell their properties. When you have too many sellers, the price always goes down.

I live in the Austin, Texas area. My tax evaluation on a property has increased by 44% over the past two years. That is a rise of 44% in the increase of property taxes as well. Currently, there just isn't enough housing in our area, even though builders continue to build as fast as they can. But as more seniors begin to sell their homes, the panic to sell will drive the prices lower for housing in our area.


The above chart shows the peak of BOOMER YEARS being from 1958 until 1962. This means the largest number of seniors will be potentially selling their homes and down sizing over the next ten years. Expectations is a deflation in the real estate market.

THE TRUTH ABOUT DEBT

One of my favorite economist is Dr Lacy Hunt in Austin, Texas. His credentials go on and on, including his time spent on the Federal Reserve board. He knows the angles, but has begun to share just a bit of his perspective. Take a moment to listen on YouTube. Click Here for Dr Lacy Hunt

The Federal Reserve and our politicians have put us into a place that is becoming harder to get out of. Continued national debt and private debt has pushed us into a Japan like scenario at least and a Greece like scenario at worst. We can boast of the strength of the dollar, but only because all the other currencies are doing so poorly. In the next ten years, the interest in our U.S. debt alone will push us near bankruptcy. Even worse, to sustain current levels of spending growth would more than saturate our capacity to pay for all the benefits. Our average GDP since 1776 has been 3.8 and over the past decade we have averaged 1.9 GDP. Even that average of 1.9 GDP has been declining over the past two years.

WHAT TO DO

We will continue to see a flat to declining economy. There is no lift-off in the economy, only a continued lift-off wish used to get investors into a declining market. As hard as it might seem to stay light in stocks, keeping a larger cash position is a better choice at this time. After a market decline, then you can consider the stock position.

Wait for the 15%, 30%, even 50% fall in the market. Then you can re-enter a stock position. Once a recession begins, expect about a year or two in the decline. Most of all, use good judgment. In an era of experimental economics by the FED there are any number of poor outcomes.

(Note: the above information is for entertainment purposes only and should not be used in anyway to make financial decisions.)


Monday, July 20, 2015

Today's Market
by Dr Invest


There is a sadness when you consider that much of what seems legitimate news reports on the condition of our U.S. economy is simply false. This falseness is a collaboration between government, wall street, the banks, and the business news media.

If none of these sources are reliable, then who can we go to? Your investment adviser would seem to be the answer, but he is part of that collaborative circle and his major goal is to capture your investment portfolio and then sell it to... well, yes, "wall street".

So, the investor is fleeced by group of perpetrators who have collaborated together to take his hard earned wealth. Although I seldom speak about politicians, today I read that Hillary Clinton had revised her promise to only raise taxes no higher than 20% on the wealthy, and now believes that 30% or more would be fair. This, she believes, would force the wealthy to spend more money in training and hiring the unemployed. The point is that the fleecing continues under the pretense that investors are becoming filthy rich from their investments.

A Plethora of Evidence 

On almost every level our economy has and is failing. Regarding DEBT, our nation is ridiculously borrowing money. U.S. debt has doubled under the current president.  Other countries are selling their U.S. Treasuries. (selling the debt they purchased from the U.S.)  They are selling their U.S. treasuries because the dollar is at an all-time high and many of these countries need extra money. Regarding UNEMPLOYMENT, our government is claiming that we are now at a 5% rate of unemployment. This kind of technical, but if you used an older method (pre-obama) of counting the unemployed, we would have a 23% rate of unemployment. Regarding STOCK MARKET GROWTH, stock prices have risen dramatically, but with a falling participation in the market. (market volume) The stock market has never continued to climb with a falling volume. At some point, the energy dissipates and the market falls.

For Example: Imagine that only 100 people bid on IBM stock. Now there are 200 million people who are not interested in IBM stock, but these 100 buyers/bidders begin by looking at a price of $50. Two of them are willing to pay $51 while the others, who desperately want to make some money, see the price movement upward. Three others make a bid for $52. The original two make a bid for $53. Because these investors NEED TO MAKE MONEY, the price keeps climbing. There are only a few speculators who are moving the IBM stock upward. This takes us to the idea of PRICE TO EARNINGS RATIO, which is called, PE. Now PE determines how many years it will take for a stock to return value. A PE of 18, the average PE, would take 18 years. A PE of 27, which is where many stocks are valued in today's market would take 27 years to see its value returned to you. 

Dr. Robert Shiller of Yale, created what was called the CAPE to measure the PE ratio. He recently warned (two months ago) that the U.S. stock market was too rich (overvalued) and the PE ratios too high.

Now I can keep going from chart to chart and from subject to subject to show how the evidence points to a stalling economy. The government declared that all businesses will now pay for their full-time employees healthcare. Business answered that declaration by only giving employees 30 hours a week so they would be considered part-time employees. The result was less income for workers. The workers were PUNISHED for the government's solution to make private enterprise pay for their healthcare.

With Obamacare came new taxes and penalties. All of the companies participating in Obamacare are now asking for substantial increases in premiums because they can't make a profit from so few people participating in Obamacare. In 2016, once Obamacare is fully implemented, the full impact of Obamacare will be felt. Obama will be out of office, but blaming the failure of Obamacare on some political outcome.

In all fairness none of this is entirely the fault of the Obama Administration. In only a few short decades, our government of both Democrats and Republicans have managed to put us into debt for many years ahead. The answer is to cut benefits and cut government agencies, instead; our government is enlarging healthcare programs, agencies, and its footprint.

James Dale Davidson has made some interesting observations. In the enclosed video, he is trying to sell his newsletter. I wouldn't buy it, but some of his points are viable. Davidson Video

Ron Paul has also made a video which an investor really needs to see. ron paul

Again, it seems to me that more people are trying to fleece investors by selling them newsletters. That is no my game. But still, if you you understand that the market could turn ugly at any moment you will be better prepared to get out of your investments that will drop 50% to 70%.

My suggestion is to stay light and be prepared to move out of the market. Stop sells are key. You can't wait too long to get out, so if you have had a long run of great returns, you could sell if you loose 10% to 12%. Some would call this a market correction, but I would rather be out of the market wishing I was in, than to be in the market wishing that I was out.

Before a real downturn, there will be a series of ups and downs. Some will interpret the initial downturn as simply a market correction. People will see it as a buying opportunity so stocks will rebound for a while. But because there will not be enough momentum/growth, the market will return to its original downturn. This is were people will recognize that a real market downturn is underway.

Do I believe in the "end of days" market collapse? No! But it sure can feel like the "end of days". So the secret is being prepared. Get your chicken off the grill... get your money out of stocks. Protect your gains.

Finally, if you haven't been fully invested in the market, don't get into the market now. This is not the right time. Wait until there is a full market downturn. This could take any where from one to two years to fully unfold once a downturn has begun. Even a mild downturn could be 30% and a serious downturn will see losses nearing 50%.  So get out of the market quickly with a stop sell, stay out of the market until people seem really desperate and then begin to buy. You can buy VTI which is Vanguard's full market index and will not have to figure out which stocks to buy if you were building a portfolio.

Think about some of these ideas, but most importantly, become mentally prepared for a downturn.

(note: the above article is for entertainment purposes and in no way is to be used as investment advice.)


Thursday, March 26, 2015

Today's Market
by Dr Invest


In my last article, I alluded to consumer spending being down. This is because many corporations are only offering part-time jobs, which continue to be low-pay and circumvent the Obamacare ACA regulations. In the U.S. full-time employees must have their medical insurance paid by the corporation. (I know I'm being simplistic here, but there's not enough space to discuss ACA.) No one would argue that workers are being paid less, that inflation has been rising, that hidden taxes, fees, and medical insurance forced upon the U.S. populace has left families with less to spend at restaurants and stores. So consumer spending is down, affecting GDP and pulling down on economic recovery. 

Brian Louis recently wrote:

Empty stores from retailers that went out of business years ago -- such as Borders Group Inc., which had big floor plans that are hard to fill -- are dotting shopping centers across the country at a time the rest of the commercial real estate market has rebounded. They’re now going to be joined by thousands of additional stores that will soon be vacant as retailers such as RadioShack Corp. file for bankruptcy and department-store operators including J.C. Penney Co. and Macy’s Inc. cut locations to save money.

Vacancies at U.S. regional malls rose to 8 percent in the fourth quarter from 7.9 percent a year earlier, partly because of Sears Holdings Corp. store closures, according to Reis Inc. The real estate recovery for neighborhood and community shopping centers has “remained at a snail’s pace,” the New York-based research firm said in January.

Retailers and restaurateurs said last year they planned to close 5,483 locations, more than double the 2,592 in 2013, which was a record low, according to a report by the International Council of Shopping Centers and PNC Financial Services Group Inc. Last year’s total was the highest since 2010, according to the study.

Since then, retailers including apparel chains Wet Seal Inc. and Cache Inc. have filed for bankruptcy. Fort Worth, Texas-based RadioShack, with about 4,000 locations, sought protection from creditors on Feb. 5.

More troublesome for landlords than the relatively small Wet Seal and RadioShack locations are the spaces being abandoned by J.C. Penney and Macy’s. Replacement tenants will be difficult to find for those stores, with their large footprints. Macy’s Inc., based in Cincinnati, said in January that it will cut 14 of its approximately 790 Macy’s store locations within a few months. Plano, Texas-based J.C. Penney said it would close 40 stores around the U.S. this year.

Today's headline that unemployment has never been lower is admirable, but says little about the real condition of our economy. We may well see a dramatic recovery from yesterday's dramatic losses in the market, but the underlying economic sickness remains. Since 2012, when stimulus and bond buying began, our economy has been on life support. It is only a matter of time before economic conditions slip lower and a dreaded recession wipes away trillions in stock gains and the dreams of financial security.

(note: the above article is for entertainment purposes only and not to be used in anyway as financial advice.)

Wednesday, March 25, 2015

Today's Market
by Dr Invest


Only now have analyst begun to admit that there are flaws in our U.S. economy, and only after a continued troubling downturn in the market. Shiller, professor at Yale, acknowledged that he was getting out of U.S. stocks, later saying that investors were continuing to invest in stocks out of fear. Stocks, he said, are the only game in town and that investors were exchanging risks for returns.

David Rosenberg took a step back to highlight four of the biggest obstacles facing the bull market.
Rosenberg, a typically bullish analyst  outlined:
  1. Earnings momentum has slowed. Bottom-up consensus forecasts for S&P 500 operating earnings growth in the first quarter have fallen to -3.1% from +5.3% year-over-year. "The second quarter has been sliced to -0.7% YoY as well, so technically speaking we could be looking at a mild profits recession here in the US – this is down from the +5.9% estimate at the start of the year," he wrote.
  2. Valuations are high. The trailing P/E ratio is 20x, compared to the long-run norm of 16x. "It actually is not all that uncommon to see the equity market up in years when EPS growth is flat-ish (as the consensus now believes for 2015) but that requires price-to-earnings multiple expansion."
  3. Economic data has been disappointing. The Citigroup Economic Surprise Index is at the lowest level since August 2011, and in that month, the S&P 500 dipped in a way that led some to think the economic cycle was turning.
  4. The strong dollar is hurting profits. "There is such a thing as too much of a good thing," Rosenberg wrote, and the dollar bull market is not over. He advised investors to avoid sectors that have EPS forecasts below zero, including Utilities (-6.6%) and Telecom (-0.8%.)

Up until last week, no analyst would acknowledge these grim figures. There was only the acknowledgement of a economy reaching velocity to break free of the recessionary levels held the past five years. Even president Obama touted how strong the economy had become under his leadership with employment reaching new highs. The problem is that the improvement in employment has come in part-time jobs that are relative low pay. Companies, seeking to avoid paying for the healthcare of full-time employees have begun to offer only part-time positions. Now heads of households must hold two part-time jobs and then those jobs pay less. When those jobs are recorded, they are recorded as though two people are now employed, when only one person has two jobs.

You may have a short memory, but back in the recession of 2008 there was a change in the way statistics were reported that made the GDP appear more robust, a kind of rewriting of the rules. Most of these changes were because of politics, so our economy would appear more robust. 

The reality is that people are making less income and they are being taxed more. Rules have been rewritten in the U.S. tax code so you pay more... more in fees if you don't have medical insurance... more in fees if you sell a second home (NIT), fees called medicare surtax, and redefining pretax income. (For instance, before 2014 your company could pay for your heath insurance and it would not be counted as income to you. Now the $10,000 to $15,000 your company pays for your health insurance must be added to your total income. So if your company paid $10,000 for your health insurance and your salary was $50,000 a year.... your total income would now be reported as $60,000. Effectively, your are being taxed more, even if taxes were not raised.)

Taxes put a drag on growth. Add to the mix a over valued dollar and declining consumer purchases and you have a recipe for disaster. So hold on to your hats, because the wind is picking up. Politicians and Wall Street brokers will continue their mantra that the economy is taking off. Don't believe it!

(note: the above information is for entertainment purposes only and not to be used in anyway as investment advice.)