Monday, August 18, 2014

Today's Market
by Dr Invest


While reading some research today, I came across a chart that confirms some of the ideas and concerns I have about the present market. Before I present the chart, let me be clear, in the short run, I think the market will continue its climb. Dr Robert Schiller's use of "Irrational Exuberance", a professor at Yale, was picked up by Alan Greenspan and used in a speech he made in 1996. Dr Schiller is also know for developing a more accurate measure of P/E ratio (price to earnings). He called that measure CAPE or Cyclically Adjusted PE. Schiller recently affirmed that stock prices had too rich valuations and were over priced. This is contrary to some Analysts who are trying to tell the public that "now is the time to buy because stocks have never been cheaper. 

Daniel J. Want, recently improved on the CAPE ratio by using the Baa yield. This seems to smooth out the data and give a more correct valuation. For those wanting the details, go to: http://thecrux.com/this-powerful-indicator-says-a-major-top-is-approaching/

Here is the chart:


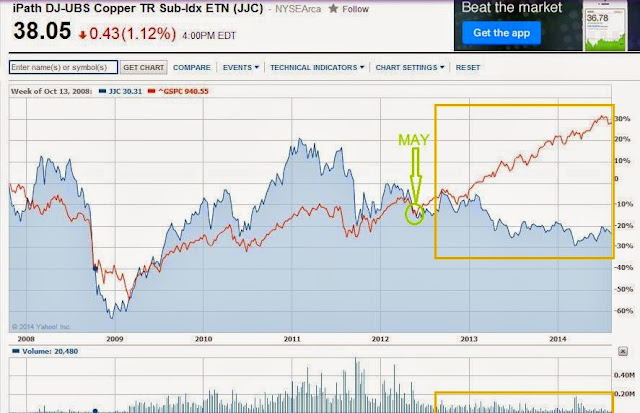
Note the sudden dip around 2012 in the RED LINE, stock valuations had begun to fall, but were pushed higher as Bernanke started the $60bln per month by back of bonds. The valuation of stocks as risen, almost as high as any of the previous valuations preceding each recession. Stock are NOT at all-time lows, but all-time highs. As my chart below shows, copper prices dropped in May 2012, but the S&P continued to climb. Copper and the S&P are typically correlated and move together. In the yellow frame is copper and the S&P moving opposite of one another. This is at the same time in 2012, in the chart above, that shows stocks moving into rich valuations due to FED stimulus. 


Enjoy this exuberant moment... and it well could last, pushing the S&P to remarkable heights... but when the sudden and incalculable moment arises for its fall, without warning the stock market will make 2009 seem like a picnic. 

My suggestion, be cautious until the market has turned downward.

(Note: the above information is for entertainment purposes only and not to be used in any way as investment advice.)

Thursday, August 14, 2014

Today's Market
by Dr Invest

Someone recently asked me about our current market situation. My assessment is "EXUBERANT". Even the financial analysts can't admit to the obvious decline in current economic fundamentals and they advise that stocks are at an all-time low in valuation, that the market is almost non-volatile, and that the economy is rebounding. It is like whistling past a grave yard! Their advice is cheery, but you feel a bit uneasy that something is gonna jump out and get ya!

I've pointed you to the reports at Hussman Funds and at Economic Cycle Research Institute. I reported that a decline in economic fundamentals began in May of 2012 at which time the Federal Reserve began a major bond buying program to stimulate the economy. A stock market down-trend did not take hold and Bernake was able to muscle the stock market ever higher. Since interest nor stock dividends no longer provided a safe haven for investments, the only game in town were stocks. Speculation in stocks continue to drive the stock market higher, so that most stocks are overvalued at this time. Look at the chart I have provided below:


There are several things worth noting. First, the blue represents the price of copper. Most of you know that as the price of copper goes up, so do the stock prices. A drop in copper prices are certainly the indicator that the prices of stocks will soon follow. (see the yellow box showing an inverse pattern)

In 2012, there was the formation of a head and shoulders pattern, indicating a down turn in the market. That down turn was arrested by FED intervention. You would typically say, "Great, now let's make money!"  The problem is that though the S&P continues its climb, copper continues to decline after May of 2012. Copper prices are telling us something. Copper is suddenly inverse of the price of stocks. This is very unusual and out-of-the-ordinary. Another telling indicator is represented by the VOLUME of trading. From the middle of 2013 until April of 2014, the volume is about as low as 2008 into 2009. There is a temporary spike in 2014, but the volume quickly falls to its previous levels as the "good news" of the economy is overtaken by the true state of our economic realities. 

The Realities

Stocks continue to climb because there is no other game in town, and because the Federal Reserve continues its stimulus. There isn't any real confirmation of a strong uptrend because the volumes remain low. It is the speculators and the corporate stock buy-backs that keep the price of stocks rising. Analysts and financial advisers don't want the merry-go round to stop, so they keep pumping stocks. Still, a large percentage of people refuse to put their cash back into stocks. Several bubbles have started because of FED stimulus, and by almost all standards of measurement, excepting the government's standard of measurement, there is an indication that inflation is on the rise. When the general public was asked the question, "Do you feel richer today than you did three years ago, almost everyone responded with a resolute NO!" Though there is no standard of measurement by which the public can measure inflation, the general public feels poorer as costs continue to rise. 

A Few Voices Trumpeting the Truth

For the first time there are a few voices trumpeting a contrarian view, and some of these voices have been long-term bulls. They warn of caution moving forward. Today's headline was "Shares, bonds rally as investors bank on ceaseless stimulus." This current false rally can be pushed further as economies are propped up by the central banking system. The German economy is now needing stimulus as trade with Russia wanes. Portugal, Italy, Ireland, Greece, and Spain have done little to pull out of their economic doldrums. No matter how much money continues to be thrown at these economies, unless the economic fundamentals change, it is only a matter of time before a crisis. 

What to Do

Governments must cut their spending, reduce taxes on their citizens, reduce the size of government, reduce their debt, reduce the myriad of laws and regulations that destroy productivity, and abolish the Federal Reserve. Obama Care will result in an economic drag as insurance companies raise their rates and the consumers begin to pay the higher deductibles. A close friend, told me of her grand-daughter who has a blood disease, where the blood thickens. Costs for treatment... $56K per month. The insurance company underwrote the policy for Obama Care, told the 16 year-old that she would be dropped because there was an error in her address. (This is called, RECISSION) Insurance Companies have to sign you up, but they don't have to keep you.) She will be able to apply again for insurance in October, if she lives that long. We fundamentally know that change is needed, but who will stand up and take the criticism for suggesting such ideas. And yes, the U.S. without a Federal Reserve for a number of years. (See Andrew Jackson and the Federal Reserve)

What to Expect

Expect consumer spending to remain low. Expect companies to build stockpiles of unsold inventory. Expect the FED to continue stimulating the economy. Expect companies to buy up their own stocks to keep their stock prices artificially high and in demand. Expect stock prices to keep climbing... as long as stimulus continues. Expect economic energy (the GDP) to decline further. Expect companies to lay off workers again as unsold inventory builds up in warehouses. Expect the economic outlook to become soured as sales fail to ignite. Expect salaries to remain low. Expect layoffs to begin rising again. Expect stock prices to fall as profits decline. 

When will this happen? At any moment between now and the next two years! A crash has already been averted over the past two years, since 2012. The government might be able to hold off a recession another two years, but it seems unlikely that they can continue the current path they have taken. If you have stock positions, keep them; but use a stop-sell to sell them upon a sudden decline. If you don't have stock positions right now, don't buy them. Cash is King.

Explained Before

Typical business cycles would be 4 years bull market and 2 years bear market. A typical down trend will carry stocks down around 50% (or at least in the past recessions). So you start with a $100,000 investment, there is a recession and you lose 50% of your investment. You now have $50,000 invested. If your are invested in the S&P 500 index and it grows 100% over the next 4 year bull market, your portfolio will now be worth its original $100,000. 

If you held the $100,000 investment in CASH, and invested it in the S&P 500 index at the start of a 4 year bull market, and the market grew 100%, you now would have $200,000 in your portfolio. For a closer look, that 100% gain over a 4 year bull market would have averaged 25% per year. If you count both a 2 year bear and 4 year bull, your gains over a six year period would still be 16.6% annually. 

If you are wanting to invest, start at the bottom of the business cycle. Buy stocks cheap, and then let them grow. If you buy stocks now, you will buy them HIGH. The price you pay for a stock is projection of where you think profits will be in the future. I don't believe that profits will continue to remain high, but that's another subject. Like a Boy Scout, if you are not prepared, get prepared. A bear market is closer than you think. 

(Note: The above article is for entertainment purposes only and not to be taken as investment advice.)