Today's Market
by Dr Invest
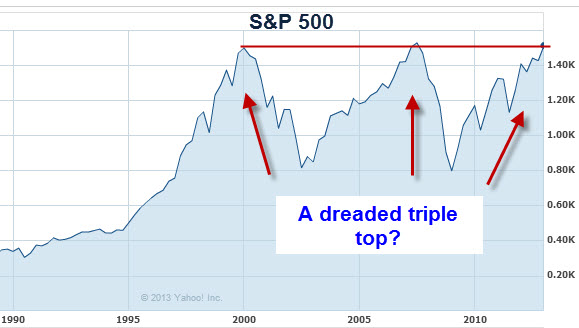
After yesterday's post, I did a little more research on the Triple Top Stock Pattern. The S&P 500 is displaying this signal over the LARGE MARKET. This is disconcerting at the least and if true, it is potentially an event of a great magnitude. I am fully aware of the market exuberance and the bullish trend purported by most of the investment community. This exuberance continues in the light of a weak GDP and poor growth. Even with continued stimulus purchases by the Federal Reserve, the government's own estimations of growth for the remainder of the year is a tepid .8%. We are moving into August and September, months with traditionally poor stock performance as seasonal averages. Adding to this world-wide recession, lower corporate profits, and over 4 years into a bull market that typically falls to a bear market between the 4th and 5th year, and you have multiple factors that could set the market up for a serious downtrend.
THE TRIPLE TOP

If the overall market is at a TRIPLE TOP (pattern), then the outcome is a move below the baseline. As predicted by Chris Martenson, a 60% decline could be possible. This is why John Hussman sees the gains brought by greater risks, completely erased by a sudden decline in the market. Remember that if your portfolio simply falls 50%, you must see a 100% gain to return you back to your original portfolio's balance.
In this scenario, the S&P returns to the baseline, losing 800 points and possibly even another 800 points as it plunges below the baseline/support. This means repeating 2008 and possibly even below the lows of 2008.
DOUG SHORT

Go to: http://cybertradinguniversity.com/new/uncategorized/is-the-sp500-forming-a-triple-top-pattern/
to read the details of what someone else also discovered regarding this TRIPLE TOP FORMATION.
THERE IS ONE OTHER POSSIBILITY
Admittedly, there is one other possibility in this TRIPLE TOP PATTERN, a TRIPLE TOP BREAKOUT. This would present a remarkable buying opportunity, with the S&P 500 strongly rising another 800 points. The problem is that we don't have anything near a dynamic growth in the market, so this scenario seems very unlikely.

THE POWER OF GOVERNMENT MANIPULATION
Over the past year and a half, I have seen the power of the Federal Reserve in action. The promise of stimulus kept the stock market rising, and then when promises could no longer keep investors in the market, Bernanke began his massive QE through the purchase of bonds and bad mortgages. That step moved the FED from an adviser to an actor. The market could not fail, because the FED was invested along with the banks, funds, and private individuals. Even the hint of reducing QE put the market into a swoon, sending mortgage rates to new highs. Only after a carefully worded apology by Bernanke, explaining that no reduction would occur in the near future,"maybe... er... unless I think it necessary...but...uh...I don't think it is necessary now...umm... if unemployment stays above 6%...but ...er... then we might consider reducing bond purchases... uh... if we want to!" so said, Bernanke. But cautiously accepting this new apology by Bernanke and believing that Bernanke would now play fair, the STOCK BUYING PARTY has continued, pushing the market indexes higher and higher.
It seems to me that the Federal Reserve could keep the market climbing. In May was a clear Head and Shoulders Pattern, but Bernanke's promises to keep the bond buying pushed the market out of this potential deadly pattern. So here we are again, a pattern that portends a solid downtrend, only the market knows if it will accept Bernanke's reassurances that the Federal Reserve will keep the Bear's at bay.
(Note: the above article is for entertainment purposes only and not to be used as investment advice.)
by Dr Invest
After yesterday's post, I did a little more research on the Triple Top Stock Pattern. The S&P 500 is displaying this signal over the LARGE MARKET. This is disconcerting at the least and if true, it is potentially an event of a great magnitude. I am fully aware of the market exuberance and the bullish trend purported by most of the investment community. This exuberance continues in the light of a weak GDP and poor growth. Even with continued stimulus purchases by the Federal Reserve, the government's own estimations of growth for the remainder of the year is a tepid .8%. We are moving into August and September, months with traditionally poor stock performance as seasonal averages. Adding to this world-wide recession, lower corporate profits, and over 4 years into a bull market that typically falls to a bear market between the 4th and 5th year, and you have multiple factors that could set the market up for a serious downtrend.
THE TRIPLE TOP
If the overall market is at a TRIPLE TOP (pattern), then the outcome is a move below the baseline. As predicted by Chris Martenson, a 60% decline could be possible. This is why John Hussman sees the gains brought by greater risks, completely erased by a sudden decline in the market. Remember that if your portfolio simply falls 50%, you must see a 100% gain to return you back to your original portfolio's balance.
In this scenario, the S&P returns to the baseline, losing 800 points and possibly even another 800 points as it plunges below the baseline/support. This means repeating 2008 and possibly even below the lows of 2008.
DOUG SHORT
So, what is fundamental analysis telling us about the SP500's potential "Triple Top" pattern? Interestingly, a broad market valuation measure called the "Tobin's Q Ratio", which has spotted every important generational stock market top of the past century, shows that stocks are quite expensive and comparable to past valuation levels that occurred at important prior market tops:
Chart Source: Doug Short, Advisor Perspectives
A historically-successful investment strategy is to buy stocks when the Tobin Q-Ratio is low, like in the early-1950s and early 1980s, and sell stocks when the Q-Ratio is high, like in 1929, the late-1960s and in 2000.
to read the details of what someone else also discovered regarding this TRIPLE TOP FORMATION.
THERE IS ONE OTHER POSSIBILITY
Admittedly, there is one other possibility in this TRIPLE TOP PATTERN, a TRIPLE TOP BREAKOUT. This would present a remarkable buying opportunity, with the S&P 500 strongly rising another 800 points. The problem is that we don't have anything near a dynamic growth in the market, so this scenario seems very unlikely.
THE POWER OF GOVERNMENT MANIPULATION
Over the past year and a half, I have seen the power of the Federal Reserve in action. The promise of stimulus kept the stock market rising, and then when promises could no longer keep investors in the market, Bernanke began his massive QE through the purchase of bonds and bad mortgages. That step moved the FED from an adviser to an actor. The market could not fail, because the FED was invested along with the banks, funds, and private individuals. Even the hint of reducing QE put the market into a swoon, sending mortgage rates to new highs. Only after a carefully worded apology by Bernanke, explaining that no reduction would occur in the near future,"maybe... er... unless I think it necessary...but...uh...I don't think it is necessary now...umm... if unemployment stays above 6%...but ...er... then we might consider reducing bond purchases... uh... if we want to!" so said, Bernanke. But cautiously accepting this new apology by Bernanke and believing that Bernanke would now play fair, the STOCK BUYING PARTY has continued, pushing the market indexes higher and higher.
It seems to me that the Federal Reserve could keep the market climbing. In May was a clear Head and Shoulders Pattern, but Bernanke's promises to keep the bond buying pushed the market out of this potential deadly pattern. So here we are again, a pattern that portends a solid downtrend, only the market knows if it will accept Bernanke's reassurances that the Federal Reserve will keep the Bear's at bay.
(Note: the above article is for entertainment purposes only and not to be used as investment advice.)