Sunday, December 1, 2013

Today's Market
by Dr Invest

Over the past months, the market continues an upward climb. One would think that we are setting on an economic rocket. While the GDP is expected to grow barely over 2%, growth projections over the next 10 years for the GDP is estimated at only around 1.8%.

The problem is that a double digit growth in commodities in 2013 doesn't reflect the actual weakness in the economy. Analysts have acknowledged that the economy is weak and will be even weaker in 2014 because of increased taxes from Obamacare. Adding to the increase in taxes is the requirement that families purchase medical insurance. Even with subsidies, the poor will see a drain on their total income as they pay something for their health insurance. This means less money per household for consumables. This is why the projection is decreased for overall GDP. When you don't have extra money to spend, you put off buying a car, a washing machine, a television, a computer...etc. The economy never heats up... it can't heat up, because the economy is stagnant.

The greatest fear is that we will return to the STAGFLATION of the 70s. Government stimulus pushes prices higher, but taxation and debt bring recession as people have less to spend. Experimental Economics will result in even larger bubbles and the outcome will result is great sorrow. The poor will become poorer, the middle class will slip into poverty, and the wealthy will become less wealthy. Because people are earning less, state and national government will collect less taxes and pressure will be put upon politicians to tax the wealthy even more.

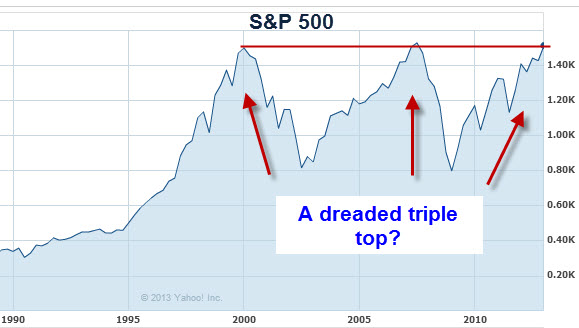
There is no significant growth in the economy, but rather a significant slowing. Stocks are being priced in at some FUTURE value, but when it is clear that that "future value" cannot be achieve, there will be a sudden sickening sell-off.

Knowing that the economy is deteriorating, I couldn't risk the potential losses that are sure to come. I continue to hold some bond positions and a few stock positions but believe that a downtrend will begin in the first six months of 2014. As I have already said, the economy has deteriorated over the past two years. The government has set new guidelines for the CALCULATION OF INFLATION, the CALCULATION OF UNEMPLOYMENT, and the CALCULATION OF GDP that makes the economy appear more robust that it actually is. Everyone knows that this is simply a "fudging of numbers" and "creative accounting". If you or I did the same kind of accounting, we would be immediately charged for criminal conduct.

SUGGESTIONS

If you are already in a stock position, keep a stop-sell on your positions. For example, if you have seen an increase of 15%, a stop-loss set at 10% might be acceptable for 2013. If the new Fed Chairman keeps stimulating, your stocks could rise even further until a collapse in the market is achieved. If you do not hold stock positions, don't buy them now. Stay away! Stocks are overvalued and overbought. Go buy a good certificate of deposit until the storm passes.

The above information is for entertainment purposes only and should not be used as investment advice.

Wednesday, November 6, 2013

Today's Market
by Dr Invest

Not much has changed for the small investor. Do you want to get into an already overbought market? Today we broke new highs. What is troubling is that the new highs are not based on any true economic recovery. The volume of stocks bought has been low as compared to the prices of stocks that are soaring. This trend is very disconcerting to many investors.

DEFLATIONARY PRESSURES

The prediction is that retailers will see consumers restricting their purchases this Christmas Season. To spark interest in the consumer, the retailers will have to LOWER THEIR PRICES. This brings deflationary pressures to market. Retailers ask wholesalers for a reduction in prices, wholesalers ask factories for a reduction in prices and so forth. Factories may layoff workers or ask them to make concessions. The workers have less money and begin to look for their own lower priced bargains.

Yes, this is the PRE-STAGFLATION period, where some areas inflate and other deflate. Yesterday, I met with a community board of directors. One of our board members, who serves on a number of local boards, explained how financially troubled several of the non-profit organizations were. I asked for his opinion on the reasons. He said, "Those who give, most often seniors, lost 40% of their investments in 2008. Even after a remarkable rise in the stock market, many have not fully recovered."

When you think about it, you lose 40% of $500K or $200K. Now you have $300K remaining in your nest egg. If you are withdrawing 8% annually for retirement income, that amounts to $120K over a five year period. You lose another 2% to an investment adviser and 3% to inflation which amounts to $75K over a 5 year period. Only half of your $300K is invested in stocks or $150K. Bonds have been tepid. So almost $200K is spent of the $300K. Without going in to the detailed calculations, you might have $400K remaining of the original $500K. At this point you are saying, "I need to save money! I haven't even reached the wealth I had five years ago.

EURO DEFLATIONARY PRESSURES

So analysis released a report today, saying that the ECB (European Central Bank) was under the threat of deflation and could force the bank's hand soon. The rate of inflation had slowed unexpectedly to just 0.7%, the lowest rate in four years, tripping a vicious cycle of falling prices, wages, and output.

While we in the U.S. are in a little better position, a deflationary cycle in the EURO would definitely effect our own economy. This is the danger of stimulus. You can either heat-up the economy or have liquidity that no one can access. We have plenty of liquidity in the U.S. , but no one can borrow it!  Those who can access the liquidity don't need it.

STAY ALERT

Go back to the previous two articles. I expect that a clear direction will emerge in the next three months. I am not ready to accept the risks and have been out of stocks for the past year. Regardless the gains, the potential losses could break you. Presently, I am waiting for a decline in stock prices and an entry point where stocks are not overvalued.

(Note: the above information is for entertainment purposes only and not to be used as investment advice.)

Friday, September 20, 2013

Today's Market
by Dr Invest

If you have been following this blog, you are probably waiting for some turn-around news. For the past two years, I have been reducing my position in stocks. Others have been increasing their position in stocks as the market has climbed to new highs. I am reminded that "I would rather be out of the market wishing I was in, than to be in the market wishing I was out." I have missed a "big move" in the market. But with a market that is manipulated by the Federal Reserve and the over exuberance of investors pushing the market ever higher, I have not felt that the risk is worth the reward.

In the previous article, I have shown you a possible trending in the market and the potential for a dramatic collapse. Below is noted "DOUBLE TOP" patterns. The retreat from the high in the S&P is a likely indicator of an impending down trend. I don't believe that "government stimulus" will prevent the coming decline and could aggravate a healthy return to growth.


Buffet has complained about it being hard to find things to buy. The Darden Restaurant chain (Olive Garden, Red Lobster, and Longhorn Steakhouse) is cutting employees and trimming budgets. JC Penny continues in a decline. The government reminds us that unemployment is declining, but companies are talking about letting employees go. On one side there is the declaration of a STRONG & VIABLE MARKET, yet numerous companies are talking about part-time employees and letting full-time employees go. CNBC reported today:

Gina Martin Adams is sticking to her guns.  The Wells Fargo strategist has been bearish on stocks all year, even as she watched the S&P 500 (^GSPC) add 21 percent. And on Thursday's " Futures Now ," Adams reiterated her call that the index would close out the year at 1,440.
"Our target is based on fundamentals," Adams insisted. "We're basing our target on typical valuation measures, given the level of interest rates and also on earnings forecasts. And that's why our target is relatively low."
In fact, "low" is somewhat of an understatement. Adams' target implies that the market will drop 16 percent in little more than three months, erasing everything that stocks gained after the year's first day of trading. This makes her one of the lone bears on the Street.
So what could produce such a dismal fourth quarter for stocks? First of all, Adams is highly skeptical about the rally that the market has enjoyed thus far. "It's all about emotion at this point. The entirety of the S&P 500's increase this year has come via the multiple," Adams said. "It's been simply through the amount that investors are willing to bid up the value of the future earnings stream."
Indeed, the S&P 500's price-earnings multiple has risen from 17 on Jan. 1 to nearly 20. That means the market has largely been rising due to investors' willingness to pay more for those earnings.
I am not going to print the entire article on my blog, but her voice is not a lone voice. She expects this downtrend to unfold in the next three months. 
I have no real advice to give, other than find a competent financial adviser you can trust. Adams is suggesting a 16% decrease that would erase any profits your portfolio has gained this year. I am suggesting that a decrease would bring a SELLING PANIC, pushing the S&P down even lower. 
(Note: the above article is for entertainment purposes only and not to be used as financial advice.)

Monday, August 19, 2013

Today's Market
by Dr Invest


Over the past months, I have pointed to several key challenges for the casual investor. First, stimulus has changed the normal cycles of the market, creating distortions that make the market appear more robust than it really is. The new criteria for measuring GNP, creative accounting when it comes to measuring inflation, fudging the numbers on unemployment are all the new norm for important data provided by the government that the investor needs to make sound investments.

Added to this are the all-time high profits recorded by corporations, the highest PE (Schiller), and a remarkable climb in the market only known when GDP was at a high point; these distortions are all part of government market manipulation and government propaganda.


Indeed, no one can predict where the market will move as central banks attempt to keep their stagnant economies vibrant. This unpredictable condition can be called a "High Risk" condition. Hussman, Rogers, and Faber believe that whatever gains may have been achieved over the short-term will be lost by a rapidly declining market. Because of computer trading, the market can decline hundreds of points in a day and instead of a stair-stepping down, most market declines can appear as though they have fallen off a cliff. A good example of this was the "flash crash".  Investors are already overly cautious, even though presently invested. Most have stop-sells in place and the winners will sell out before a deep down trend sets in.

The above chart simply makes note of business cycles and patterns that may or may not apply. My guess is that the market topped on July 29th and that after a short correction, the market will top again around the end of December, collapsing as we move into 2014. The risk is too high for me to be invested in stocks at this time. I would prefer to see the market do more than correct by 10%. I am waiting for a 30% to 40%   correction where I can enter the market as it nears a new low.

Volatility in Egypt and continued decline in the European market will affect the present market. I projected in May, a potential "Head and Shoulders" formation. Bernanke's renewed commitment to stimulus moved the pattern into a "Break-out". Our own GNP and world-wide growth has been so low that the actual potential growth in the stock market should be around 1.8% or less, yet we are seeing double digit returns.

In my July 19th blog, I showed a bar chart of monthly averages from the Trader's Almanac. Both August and September have been traditionally bad months for stocks. The recent down trend in stocks is proving that the market is following the typical business cycle. Today, several analysts suggested that we would see a decline of 10%.  Looking again at the above chart, you can see that the market hits an all-time high, loses momentum, regains the previous high, and then begins trending downward.

I am projecting that a similar pattern will take place between now and January of 2014. Please be aware that the Federal Reserve will be trying to circumvent this pattern. So, just because the pattern exists, doesn't mean that the pattern will result in a recession. What I am saying, is that the probability of a recession is growing and could happen at any time or later that projected, but it will happen.

(note: the above information is for entertainment purposes only and not to be used as investment advice.)


Sunday, August 4, 2013

Today's Market
The Suit is always right!
by Dr Invest

So here we sit, waiting. If you are in the stock market your gains for 2013 have been nothing short of incredible. What is even more remarkable is that this spectacular growth in stock prices has occurred while the growth in the U.S. economy has been at an all time low. None of this really makes practical sense and everybody is well aware that the government has "cooked the books" and the Federal Reserve is "manipulating the market". Like a train wreck certain to happen, we just can't look away; fully knowing that immediate returns from stocks are due to to government stimulus, we just can't stop investing in a market that is certain to collapse. 

This past week, bullish sentiment continued to be high. The expectation is that the stock market will climb unabated. Listen the S&P has already advanced over 21% in 2013. These kind of pressures are too great to miss, even if the risk is high. This is free money, offered by the tax payers via the Federal Reserve. Why shouldn't an investor take advantage of these kind of returns?

The problem is that no one can predict when the collapse will come, but when it does, it will be sudden and without warning. Yes, there is a group economists warning about this coming calamity but the party is just getting underway. When the fall comes, most investors will find their gains erased and their fortunes lost. 

In all the years I have invested, I have never seen such a year as this. And I have never seen such a cooking of the books by the Federal Government. Read the report below:

 The 162,000 jobs the economy added in July were a disappointment. The quality of the jobs was even worse. A disproportionate number of the added jobs were part-time or low-paying — or both. Part-time work accounted for more than 65 percent of the positions employers added in July. Low-paying retailers, restaurants and bars supplied more than half July's job gain.
"You're getting jobs added, but they might not be the best-quality job," says John Canally, an economist with LPL Financial in Boston. So far this year, low-paying industries have provided 61 percent of the nation's job growth, even though these industries represent just 39 percent of overall U.S. jobs, according to Labor Department numbers analyzed by Moody's Analytics. Mid-paying industries have contributed just 22 percent of this year's job gain.
This is once again, the "cooking" of figures by the government showing remarkable declines in unemployment, but a closer looks reveals poor job opportunities and even poorer income that reduces the consumer rally to fuel a strong economic growth.

As all ways, if you are invested, guard your profits with a stop-sell. If you are not invested, stocks are over valued, over bought, and could lose value. I am planning to stay out of stocks until there is a significant decline, likely after reductions in the government's quantitative easing.

(Note: the above information is for entertainment purposes only and not to be used as investment advice.)


Tuesday, July 23, 2013

Today's Market
by Dr Invest

After yesterday's post, I did a little more research on the Triple Top Stock Pattern. The S&P 500 is displaying this signal over the LARGE MARKET. This is disconcerting at the least and if true, it is potentially an event of a great magnitude. I am fully aware of the market exuberance and the bullish trend purported by most of the investment community. This exuberance continues in the light of a weak GDP and poor growth. Even with continued stimulus purchases by the Federal Reserve, the government's own estimations of growth for the remainder of the year is a tepid .8%. We are moving into August and September, months with traditionally poor stock performance as seasonal averages. Adding to this world-wide recession, lower corporate profits, and over 4 years into a bull market that typically falls to a bear market between the 4th and 5th year, and you have multiple factors that could set the market up for a serious downtrend.

THE TRIPLE TOP

If the overall market is at a TRIPLE TOP (pattern), then the outcome is a move below the baseline. As predicted by Chris Martenson, a 60% decline could be possible. This is why John Hussman sees the gains brought by greater risks, completely erased by a sudden decline in the market. Remember that if your portfolio simply falls 50%, you must see a 100% gain to return you back to your original portfolio's balance.

In this scenario, the S&P returns to the baseline, losing 800 points and possibly even another 800 points as it plunges below the baseline/support. This means repeating 2008 and possibly even below the lows of 2008.

DOUG SHORT
So, what is fundamental analysis telling us about the SP500's potential "Triple Top" pattern? Interestingly, a broad market valuation measure called the "Tobin's Q Ratio", which has spotted every important generational stock market top of the past century, shows that stocks are quite expensive and comparable to past valuation levels that occurred at important prior market tops:
Q-Ratio-and-the-SP-Composite
A historically-successful investment strategy is to buy stocks when the Tobin Q-Ratio is low, like in the early-1950s and early 1980s, and sell stocks when the Q-Ratio is high, like in 1929, the late-1960s and in 2000.

Go to: http://cybertradinguniversity.com/new/uncategorized/is-the-sp500-forming-a-triple-top-pattern/
to read the details of what someone else also discovered regarding this TRIPLE TOP FORMATION.

THERE IS ONE OTHER POSSIBILITY

Admittedly, there is one other possibility in this TRIPLE TOP PATTERN, a TRIPLE TOP BREAKOUT. This would present a remarkable buying opportunity, with the S&P 500 strongly rising another 800 points. The problem is that we don't have anything near a dynamic growth in the market, so this scenario seems very unlikely.


THE POWER OF GOVERNMENT MANIPULATION

Over the past year and a half, I have seen the power of the Federal Reserve in action. The promise of stimulus kept the stock market rising, and then when promises could no longer keep investors in the market, Bernanke began his massive QE through the purchase of bonds and bad mortgages. That step moved the FED from an adviser to an actor. The market could not fail, because the FED was invested along with the banks, funds, and private individuals. Even the hint of reducing QE put the market into a swoon, sending mortgage rates to new highs. Only after a carefully worded apology by Bernanke, explaining that no reduction would occur in the near future,"maybe... er... unless I think it necessary...but...uh...I don't think it is necessary now...umm... if unemployment stays above 6%...but ...er... then we might consider reducing bond purchases... uh... if we want to!" so said, Bernanke. But cautiously accepting this new apology by Bernanke and believing that Bernanke would now play fair, the STOCK BUYING PARTY has continued, pushing the market indexes higher and higher.

It seems to me that the Federal Reserve could keep the market climbing. In May was a clear Head and Shoulders Pattern, but Bernanke's promises to keep the bond buying pushed the market out of this potential deadly pattern. So here we are again, a pattern that portends a solid downtrend, only the market knows if it will accept Bernanke's reassurances that the Federal Reserve will keep the Bear's at bay.

(Note: the above article is for entertainment purposes only and not to be used as investment advice.)


Monday, July 22, 2013

Today's Market
by Dr Invest

The market continues to hum along, advancing day by day. It seems that some energy has come out of the market and CYCLIC AVERAGES are not favorable for the months of August and September. One would expect a decline in the market over the next two months. The problem is that an artificial market, bolstered by central bank stimulus, doesn't respond in predictable ways.

The Federal Reserve has created a cash conundrum in that, stocks are too overpriced to get into the market and bonds are in a bubble that could collapse at any moment. Major investors are still holding cash, and are reluctant to enter stock positions where prices could collapse at any moment. Many financial advisers, touting the BUY AND HOLD philosophy, are now boasting about their returns. Since 2009, the S&P 500 has risen well over 100%, but most portfolios have not realized these theoretical gains. (Theoretical, because when stocks collapse, advisers rebalance their customer's portfolios.)

So while some portfolio managers gloat over new found successes in market (based solely on government stimulus), many have failed to look at the overall pattern that is forming over time. This is a BIGGER pattern based on the LARGE MARKET. Central Banks can control the "small market" moves, but patterns and bubbles can form that can are too big for Central Banks to control.


The Federal Reserve has done numerous stimulus programs. Before the fall of the market in 2009, the Federal Reserve attempted a stimulus program but the LARGE MARKET move downward was unstoppable. The market may well continue upward with a breakout and stock market growth over the next five years, however; a weak GDP and world-wide recessionary pressures would not make this scenario a favorable outcome. Chris Martenson is forecasting a 60% decline in stocks, to begin at any moment. (Look up the Triple Top Pattern)

I believe that each of these peaks is the result government interventions in the market. Provide people easy money policies and they will spend, but eventually this continued spending will bring the market to a point of exhaustion. We can see two peaks in the above graph showing that point of exhaustion. We are now at the third peak.

Below is a forecast for business cycles by Princeton Economics LTD. Martin Armstrong built a 8.6 year Economic Confidence Model that is fairly accurate.


As with all "generalized models" the stock market has not followed this cycle perfectly and we can still point to the intervention of the Federal Reserve, changing these normal business cycles. The Economic Confidence Model does show a downtrend in the cycle beginning in August of 2013, continuing until September of 2014.  Will this be an entry into a recessionary period?

An investor needs to be aware of potential market trends. Stocks, overvalued, and monthly cycles turning potentially turning downward in August and September, could affect short-term profits in a negative ways. Moreover, there seems to be models that forecast a downturn in the business confidence cycle beginning in August and extending into the fall of 2014. None of this may happen and all of it may happen.

These potential trends would not keep me out of market, but when combined tepid GDP growth, I would be motivated to avoid the risks in the market.

(Note: the above information is for entertainment purposes only and not to be used as investment advice.)