Tuesday, January 10, 2012


Today's Market
by Dr Invest


The talking heads are tell us how wonderful the market is and how that now is the time to empty your savings account of all the cash you have been protecting from market losses, investing while stocks are so cheap. After all, according to them, stocks will never be cheaper and to invest now is to guarantee that in only a few months you will be sitting on barrels of cash.

How long will it take for you to understand that you are being fed misinformation by people who want to take your money. When you hear, "everybody is buying" you are compelled to invest your own money. When you hear, "the economy has turned around, get in now or lose out" you feel that you will lose an opportunity to get into the market early.

Here is the secret, the volume of buyers in the stock market is not very high. This means that institutional traders are largely out. It is the day traders and beginners who are in the market right now. The market is going to turn down and when it does, there are going to be a lot of portfolio's hurt.

I want this market to reverse and move into a bull market. I want to set up my portfolio and see 2012 return 10%, 12%, even 14%. I am just like you, I want to put my money to work. But there are a number facts that point to a declining market. This is why I didn't immediately buy stock at the first part of January. So please, don't take my advice, but do your own research.

Here is the list:
A careful look at the above articles reveal one truth: When you work through the math and statistics, our economy is very weak and incapable of sustaining itself. At this time, it would be very risky to invest your portfolio into stocks. Of special interest is the article by Van Hoisington in Barron's Magazine which is first in this list. Mr. Hoisington gives a candid overview of the present market conditions.

I do like simple trades and long positions because your investment doesn't lie, you get a simple clear picture of your advances. More sophisticated methods of OPTIONS and SHORT SELLING can be used, but this blog is for the beginner. Sadly, even the professional trader can often get lost in the complications of his trading, losing track of his real gains and losses. Many times it is not until the end of the year that the trader discovers the real outcome of his complicated trading methods. My experience is that the more complicated your trades become, the greater likelihood you will lose money. Using ETFs is a simple way to diversify and play down trends, buy why? Often there is a greedy motive, but why be greedy if you can see an increase in your portfolio by 30% after holding cash for a year and reinvesting when the marke is in an uptrend? Too often, the greedy trader will attempt various methods of trading at a time when the market is most unpredictable. Listen, even the professionals have not been able to squeeze a profit from 2011. Losing 20% on most portfolios, the professionals were not able to time their trades or change their trading style to win gains in 2011.

It may take another two or three months for the recession to show it's face. I suggested in past blogs that March is the likely month, but it could be earlier or later. And then it may not happen at all because the market has the last word on what the market does. The market is irrational.

For me, I will be happy to wait until the time is right and I feel that a gain is possible. Understanding that most of the gains occur from November to January, I can wait for the incredibly hot stock market to return me gains at that time.

(note: The above article is for entertainment purposes only and not to be used as investment advice.)


Thursday, January 5, 2012

Today's Market
by Dr Invest

By all means, go to yesterday's blog. I am waiting to see where the market is going in January. Two rules I mentioned were: If the first five days of January ends down, the year will end down. Second, if January ends down, it confirms that the year will end down.

Because of the over-all weakness in the market and recent months of volatility, the concern is that the swell of hope now in the market will collapse, leaving inexperienced investors holding the tab. In a previous blog, I mentioned an important guage that you can use to determine the trend of the market.

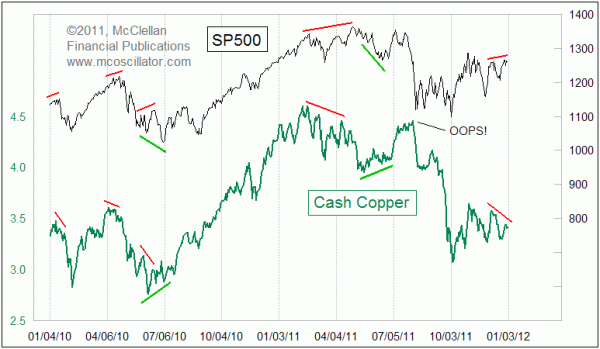
That guage is the PRICE OF COPPER. Day Traders utilize the price of copper to determine a down-trend or up-trend in the market.

Chart In Focus

Here is the problem, COPPER IS IN A DOWN-TREND. The above chart shows the S&P 500 in an small up-trend, while copper is in a down-trend. To me, this does not look good. I would see this as a pre-cursor to a market decline.

Rather than a negative view, I prefer to stay netural at this time and watch. Remember, it is always better to be out of the market, wishing you were in; rather than being in the market, wishing you were out.

So this is the dilemma of 2012, will the market break sharply upward, will the market break sharply downward, or will we continue to move pathetically side ways. Only the market knows, and it is not telling. Perhaps the next weeks will reveal what is hidden from our view.

(note: The above article is for entertainment purposes only and not to be used as investment advice.)


Wednesday, January 4, 2012


Today's Market
by Dr Invest


A lot of people want to know what is going on in this head of mine in 2012. I don't feel the need to press into investments until the time is right, that one characteristc has paid off some great dividends for me.

What I am looking for a trend. Here are some rules worth remembering in JANUARY of each year. If you look at the performance of the first five trading days in January, since 1950, an incredibly accurate pattern emerges. January's first five trading days preceded full-year gains 86.8% of the time! If the first five trading days end up, the entire year will close up. If the first five trading days end down, the entire year will close down.

Second, if you look at the performance of the entire month of January, since 1950, another awesome pattern emerges that can really help your trading. The entire month of January has preceded full-year gains 88.5% of the time! If the entire month of January ends down, the entire year will close down. If the entire month of January ends up, the entire year will end up.

Perhaps you now know why I am not jumping into the market, after all, good times for the market still remains until MAY. (The trader's rule: Go away in May, come back another day.")  If January is down, then there is a large likelihood that bad times will gather until November. I don't want to get caught in bearish crush if I can avoid it.

Concerns for Bad Stock Weather

Look, if the sky is dark and lightning is flashing, it is not the time for a picnic. You can still take a picnic, but you have to be prepared for wind, rain, and the potential storm to come. Along with the storm will come confusion, anger, and the resulting depression. It is the reverse of the joy and enjoyment you had hoped for.

The market has reflected stormy weather since August. Eventhough we have seen an eratic rise in the DOW, it is not indicative of an up trend in the market. Bernake has already warned of a tepid market and the potential slide into a recession.

While the NEWS MEDIA have talked up the fabulous up trend in the market, the Federal Bank, today, sent a white paper to Congress asking that they take some specific steps to help the housing market.

The U.S. Federal Reserve on Wednesday called for more action to stabilize the nation's ailing housing market, warning that failure to do so could harm the broader economy. In a 26-page white paper sent to Congress, the Fed outlined several potential ways to stabilize the housing market, many of which are already under discussion or being implemented by the Obama administration and housing regulators.

Read more: http://www.nasdaq.com/aspx/company-news-story.aspx?storyid=201201041417dowjonesdjonline000559&title=feds-bernanke-tells-lawmakers-more-action-needed-to-fix-housing#ixzz1iYHgQadQ

Please help me to understand this. If the stock market is in such a rally in 2012, why would Bernake be requesting help from Congress to stabilize the nation's ailing house market? I am not being an extremist, but a realist. Housing is in NO WAY turning around; the EuroEconomy is teetering on the brink, the economy is at best tepid, and the economic boosts and temporary rise in employment  from the recent Christmas season will be forgotten at the reports of the further economic and employment declines.

Let me be clear, I am not on the gloom and doom page with certain economists and analysts. I see the U.S. economy as very resilient. Yes, cuts are necessary to reduce this nation's debt and some changes must be made to our tax structure to resume an orderly trend in the market.

But as I have already said, the stock market weather looks bad and I would rather stay inside. Should the skies clear and the sun shine again, I would be more interested in returning to equities until May.

Over the next few weeks, I will make some suggestions on an immediate investment course that should be less volatile than individual stocks and less volatile than individual bonds. I have already hinted that there are some ETF's that can be purchased like stocks, can utilize a STOP-SELLs, and can be easily sold.

Many finanical institutions will sell you and indiviual bond, which you will either hold to maturity or try to sell on the market. You will buy that bond with a 2%, 4%, or 6% return, but when the market heats up and inflation climbs, the new bonds will be sold at 8%, 10%, or 12%. What will you do with your bond then? Will you keep your bond, paying you 2%, when every one else has bonds returning 12%? To whom will you sell your bond? Here is what you will do, you will sell you bond to someone else, taking a loss on your 2% gain and taking another 4%, 6%, or 8% loss from the initial investment, so you can reinvest your money elsewhere.

If you have a Bond EFT like BND, you don't have to go to the bank to sell, if the bond moves down, you simply sell it at your on-line brokerage. Another feature is that the EFT bond contains many different bonds and so is diversified. A stock ETF like VTI, contains a cross section of U.S. stocks. This kind of diversity brings you better protection if the EFT is bought and sold carefully. This kind of investment is not difficult and can bring remarkable returns if you follow some basic rules. More later, but now is not the time to invest. Perhaps later, depending on the weather.

(note: The above article is for entertainment only and not to be used as investment advice.)


Monday, January 2, 2012

Today's Market
by Dr Invest

Many of you have wondered what was the final outcome of my Christmas trades. I started the trades in the first week of November, selling the last stock just before the New Year.

The tone of the market over the two month period was very volatile with broad swings up and down. Many traders LOST MONEY. At one time, ALL my stocks neared the 6% STOP-SELL. Had the market continued downward only ONE MORE DAY, I would have experienced a 6% loss across all my investments.

STOCKS

FDO - Family Dollar was SOLD with a 1.72% gain
DLTR - Dollar Tree was SOLD with a 4.93% gain
CATM - Cardtronics ATM was SOLD with a 12.98% gain

TRADING IN 2012

Here is my suggestion. STAY AWAY FROM THE MARKET. If the market shows some upward trend over the next two months, it could be a good time to re-enter the market. It is hard for some people to understand that there are just good times to be out of the market. By the end of February, there will be some good buying opportunities because of SEASONAL TRENDS. For instance, farmers plant... they use seed and fertilize. That means that seed companies and fertilizer companies will be a positive buy.

Over the next few weeks, I will be writing about some trading ideas. ETFs, when properly entered and properly sold can provide some very reasonable returns. Last year, a portfolio of TIP, BND, VNQ, and VTI, would have returned 10%. (try this on ETFreplay.com) And yes, I was invested TIP, BND, and VNQ throughout 2011. Use the backtesting on ETFreplay.com to test the return.

There is another trick, don't enter the ETF until it rises above its 200 day Simple Moving Average SMA. If the price of the EFT moves below the 200 day SMA, sell it. Earlier in the year VNQ sold, but TIP and BND never sold. (Remember, I ALWAYS USE A STOP-SELL when buying a stock.)

So over the next few weeks, we will cover this ETF investment play in detail. When I last looked at VTI, the price had not risen above the 200 day SMA. Be careful to not blindly buy a EFT, you need to understand what you are doing. Please feel free to ask me questions.

(note: For entertainment purposes only, not to be used as financial advice.)


Sunday, December 25, 2011


Today's Market
by Dr Invest

Some of you are wondering if this is my sad Christmas, with me sitting in a corner drinking my hot cocoa all by myself. The trades I began in November did not turn out the way I had expected. A whole list of bad news stories kept the market down, with my selected stocks going up one day and down the next.

What kept me secure were the RULES of TRADING. I had already determined that I would lose no more than 6%. And at one point, all the selected stocks neared negative 6%. The market regained its footing and my selected stocks rose once again.

I patiently sat by, watching and waiting. FDO (Family Dollar) seemed to only move up in price, only to fall again and again. Believing FDO to be overbought, I sold FDO before occuring losses. DLTR (Dollar Tree) seemed to rise and fall with every news report on the prevailing outlook for Christmas sales. Although DLTR had some significant gain, I felt it best to sell before Christmas just in case the report of Christmas sales fell short. Even if the report of Christmas sales is up for 2011, it is likely that a week after Christmas, the market will have long forgotten the Christmas market glow. I do think that DLTR is a good LONG-TERM investment, but I would prefer to re-purchase  DLTR after the stock has declined a bit.

I have chosen to keep CATM (Cardtronics ATM) which is an international company, making agreements with banks world-wide to support their banks with their ATM products. This stock grew 60.9% in 2011, and with good reason; it has solid financials and will likely continue it move upward in the year ahead. Because of that, I will keep a STOP-SELL on CATM at 6% below it's daily close price. This is a fairly tight STOP-SELL but will insure that a significant downturn will be sold. As we move into 2012 I will purchase more of CATM being careful to sell all of CATM, rather than lose the core investment.

For instance: An initial purchase of $10,000 of CATM grows 20% with a STOP-SELL set at 6% below its present gain; this means that the least I will make in a sudden decline in the market is 14% of $10,000 or $11,400. When I have seen that CATM continues to TREND UPWARD, I will purchase another $10,000, making my total investment $22,000. Once again, I will set my STOP-SELL at 6% below the closing price of CATM. If, at this time, CATM suddenly declined, CATM would sell at 6% below its present price or for $20,680. (Remember my CATM was purchased in November and is now valued at 14.88% at the end of December. I will want to patiently wait until CATM grows to 20% before adding to the investment.)

As you can see by the above example, that the orginal $10,000 with a 6% STOP-LOSS, put $600 at -risk; but now, after adding an additional $10,000 to the orginal $10,000 for a total of  a $20,000 invesment, you put none of your investment at-risk and even gaining $680 in this scenario if the market suddenly turns downward. 

Assuming that CATM continues to grow even another 20% in 2012, with the $22,000 in CATM stock, the investment would grow to $26,400 for a profit of $6,400. Again, in the market you can assume nothing and must constantly adapt to the changes. The market can be better than you ever dreamed or worse than you ever imagined. ALWAYS USE STOP-SELLS and be prepared to get out of the market.

STOCKS

FDO - Family Dollar  was SOLD with a 1.72% gain
DLTR - Dollar Tree was SOLD with a 4.93% gain
CATM - Cardtronics ATM was not sold and presently has a 14.88% gain

                              The average gain over the three stocks being 7.1%

This does fall short of the 10% to 12% I had hoped to gain, but I am celebrating this Christmas. In two months, I was able to see a 7.1% gain in the fall trading season. Time will vindicate or incriminate your decisions in trading the market. For now, I have every reason to celebrate.

The MPT (MODERN PORTFOLIO)

If you are following this blog, I hope you are reading ALL of the ideas. Harry Markowitz, the father of the Modern Portfolio Theory and winner of the Nobel Prize in Economics is clearly a lot smarter than most of us.

Someone suggested that by putting 50% of your money in the ETF called, BND (a general bond fund) and 50% of your money in the EFT called, VTI (for US stock portfolio) you could beat the market and follow the MPT. (Modern Portfolio Theory)

Here is how we test that idea. Go to www.etfreplay.com and select BACKTEST ETFs. Then select: BACKTEST EFT PORTFOLIO. Under EFT 1 enter: BND and under EFT 2 enter: VTI. Go to the weighting column and give them equal weight or 50%. You will see the graph showing that without your management of only these two ETFs, your return for 2011 would have been 4.8%. In today's market, that return is admirable, especially when you consider that most portfolios have lost profit this year.

Let me give your two other EFTs to add to this portfolio and let's see how these additional ETFs will backtest. Add under the symbol column, TIP and VNQ giving each of the now four ETFs equal weight at 25%.  Your portfolio for 2011 would have returned 8.3% or almost double of 4.8% with only BND and VTI.

MAXIMIZING YOUR RETURN

By using these four ETFs (BND, TIP, VTI, & VNQ) you can see good results with little personal management. You can, however, maximize your return with minimal management by selling any ETF that moves below the 200 day simple moving average.

For example: Go to www.yahoo.com and then select FINANCE, at the top left you will see GET QUOTES, enter the ETF symbol... in this case VTI and hit the yellow button. In the left hand column that is blue, look for CHARTS and select INTERACTIVE at the bottom of the chart you now see, select 1M for one month. The chart will show VTI for a one month period. Always select 1M, so your Simple Moving Average will be correct in relationship to the price. Go to the top of the chart selecting TECHNICAL INDICATORS and then select SMA and set the SMA to 200. This is the 200 day SIMPLE MOVING AVERAGE. Now look at your chart. You will see the SMA marked on the chart. If the price is above the 200 day SMA, buy the EFT. If the price of the ETF moves below the 200 day SMA, sell the ETF.

On this date, the price of VTI is below the 200 day SMA, don't buy it. One other caution, the price of the ETF must remain above the 200 day Simple Moving Average for 30 days before purchasing the ETF. (Note: The price of VTI is moving close to the 200 day moving average, but needs to move above it and hold there for 30 days before you purchase VTI.) As of today, VNQ, a real estate investment ETF recommended here, moved above the 200 day moving average only 5 days ago, stay out of VNQ until it stays above the 200 day moving average for at least one month. Both BND and TIP prices are above the 200 day SMA and would qualify at this time for an investment. It is also advised by the IVY PORTFOLIO that after you buy one of these EFTs, you hold them for at lease a month, even if they fall below the 200 day moving average for a short while. If the price is continuing to move above the 200 day moving average, stay in the ETF for another month.

This is a simple portfolio to manage and without a lot of trades, can be very profitable. Most importantly, any ETF can be sold just like a stock. Unlike bonds, that you have to sell to someone else, or mutual funds that can only be sold at the end of a day, an EFT can be sold when you want to sell it.

Consider simpliflying your portfolio by using BND and VTI.  If you want to improve the return, add VNQ and TIP. Manage the four EFTs in your portfolio by removing an EFT that falls below its 200 day simple moving average. Having managed this portfolio by using the 200 day SMA would have returned 10.5% over 2011 and out performed the majority of the Financial Advisors recommendations.

CHANGES TO 2012 PORTFOLIO

Because of the volatility in the market, the Modern Portfolio will be my consideration as we move further into 2012. 1/3 in cash, 1/3 in stocks, 1/3 in bonds is the ideal. The Modern Portfolio theory suggests 50% in bonds and 50% in stocks, but one can modify the portfolio as best fits the investor. I would want 1/3 in BND and TIP and 1/3 in VTI and VNQ when their price is above the 200 day simple moving average. The final 1/3 kept in cash will be used for some stock purchases, but returned to cash after trades. The concern is that the EuroEconomy will affect the U.S. economy and move us closer toward a recession. Keeping the gains and retaining the core investment will be the goal.

(note: the above information is for entertainment only and not to be used for investment advice.)


Friday, December 16, 2011


Today's Market
by Dr Invest

Ho! Ho!, Just like a Yo Yo! Maybe Micheal Jackson knew something about the stock market too! I haven't blogged over the past week because there really hasn't been anything to report.

I want to get "Out of the Market", but have been waiting for the place to jump off. You will remember that in the first part of November, I purchase three stocks in hopes that the "Santa Rally" would soon be near; but upon the roof there rose such a clatter, I had to take a look at my DOW index to see what was the matter. (FDO, DLTR, CATM)

The market still seems obsessed with the EUROTRIBE and that is unlikely to go away. So stocks have fallen and rose again, and again, and again. I don't really see an end to this and it is indicative of a market getting ready to collapse. Traders are indecisive. They are just like me, desperately needing to get in, but really worried about getting out if there is a sudden long term downturn.

Well I did enter the market hoping for a 10% to 12% return. It is clear, that I will not hit that goal this year. So now, the goal is to get out before December the 24th. Next week, I will be looking for that special moment, hoping that CATM and DLTR will "YO YO" back up and I can capture a decent return for my efforts.

Return on CATM and DLTR as of today:
  • CATM up 8.70%
  • DLTR up 4.59%
I really have no reason to weep over these kind of returns, remember a year in a Certificate of Deposit might return 1.20%. Even a 4% return can beat some bonds over a year period. Though I really haven't watched these stocks very closely, I recognize the potential volatility of the market and I am ready to get out.

Let's look at the chart below and learn:


On this chart, look for two horizontal green lines, these represent a trading range. The top green line represents RESISTANCE because unless the market trend is strong, it is not likely to push above this top green line. The BOTTOM green line represents SUPPORT because unless the market trend is weak, it will likely not move below this line. In between these two lines is a TRADING RANGE. Given that there is no major good news or major bad news, the DOW is likely to remain within the TRADING RANGE. (Remember LIKELY, because nothing guarantees that the DOW, in this case, must stay within the TRADING RANGE.The political deadlock at the end of Friday moved the DOW into the red at the end of the day. In a last minute vote before Christmas, the politicians agreed to extend the payroll tax cuts.This should help the stock market rise on Monday.) The market is irrational and will act as it wants, but there is a strong likelihood that a tepid market, as we have, will continue in a sideways movement. NOW NOTICE the light greed diagonal lines. The light green diagonal line nearest the center right represents the last uptrend of the DOW. The light green diagonal line nearest the outside edge on the right, represents the present uptrend in the DOW. Good, I think you are begining to understand. Since Thursday, there has been an uptrend in the market. (represented by the black box moving upward) The EXPECTATION is that the UPTREND will continue until it meets RESISTANCE at the top green line.... somewhere around 12,300.

Another indicator of interest is the RSI indicator at the very TOP of this chart. This chart shows whether a stock is oversold or overbought. Note: when you see the stock price go down, people are selling to get out, so the RSI indicates an oversold; when there is a strong uptrend, too many people are buying stocks and the RSI will show an overbought. (see stockchart.com >chartschool) The point here is that the RSI indicator shows, that today, the DOW is a bit oversold. This makes me feel comfortable in waiting a bit longer. (Remember, there are no gurantees when using charts because you are seeing what already happened, so you can only draw approximations of where you think the market is going.)

There is another line worth mentioning and maybe even more important than the TRADING RANGE between the two green lines. It is the squiggly blue line between the two green  horizontal lines and is called the 50 DAY MOVING AVERAGE. So the 50 day moving average is critical and the DOW has to remain above the 50 day moving average.

In the DOW's present UPTREND, the top green horizontal line at 12,300 is the point at which the market could return to a downtrend.  Though the market is not moving STRONGLY UPWARD, I would expect the market to continue on an uptrend through Monday & Tuesday. I will see Monday and Tuesday as selling opportunities for DLTR and CATM.

Now all of this is rather FOOLISH TALK, because we don't know what the market will do. Israel might bomb IRAN, at which time the market is certain to NOSE DIVE. Europe might disband the EURO, and again the market would surely nose dive. This is simply part of TRADING STOCKS, live with it! Don't put all your (eggs) investments into one basket. Keep some in cash, some in real estate, some in gold, some in bonds. Most importantly, reduce your loss by using STOP-SELLS.

Knowing the importance of getting out of these two stocks next week and understanding that the market needs to remain in an UPTREND, I do look to a higher power than me for the benevolent blessings to come.

(Note: the above article is soley for entertainment purposes and not to be used as financial advice of any kind.)

Monday, December 5, 2011

Today's Market
by Dr Invest

One of the more joyful moments is when the market turns in your favor. Still, you can't trust your emotions, even though you have them. The market alone is the sole determinate of market price and trend. The market is not rational; when you think it should go up, it goes down and when you think it should go down, it goes up.

There are, though, certain seasonal trends that improve your chances to take a profit. The market is presently EXPLOSIVE, volatile. I would not enter the market at this time and believe that we have two more weeks of a postive market trend, which is not enough time to carefully invest in the market. STAY OUT OF THE MARKET!

MY RECENT TRADING HISTORY

On November 9th, I purchased DLTR (dollar tree), FDO (family dollar), and CATM (cardtronics). All three started with a bang and returns of 2%, 3%, and 6% and within days had each sunk below 5% in the negative by Thanksgiving weekend. I had placed a 6% stop-sell and was convinced that all three would end up selling, leaving me with a 6% loss.

If you have been following this blog, you will see that I operate by a set of carefully crafted rules. For example: (1.) only buy stock with a proven uptrend; (2.) buy selected stock when in a temporary dip; (3.) determine how much you are willing to loose before making a purchase; (4.) Learn the behavior of a stock during its one day period and purchase when the stock is typically lowest during its day trading period; (5.) place a STOP-SELL on the stock when you buy it, set for the amount you are willing to loose in the trade (what you are betting on is your judgment); (6.) be patient and wait, even if the stock is going down. (7.) when your stock rises 1 time above the percentage of your STOP-SELL, move the STOP-SELL to half the percentage above the purchase price. (you set the stop-sell at 6% below purchase price, when the closing price rises to 6% above the original purchase price set your new STOP-SELL at 3% above the original purchase price of the stock. As the stock continues to rise, move the STOP-SELL behind the closing price by 3%. [you can also use a  TRAILING-STOP which follows the closing price automatically]). (8.) Ideally, you want to stay in the market as long as the stock will continue its upward trend. A more volatile stock may mean setting a higher percentage. It the stock moves up or down 3% at each market turn (up or down), you may need to set the percentage at 12% because you are taking a greater risk for purchasing a stock that grows more quickly or may fall more quickly. (9.) The most important rule is: DON'T LOSE MONEY!

PRESENT RETURNS ON STOCK INVESTMENT

                                                      BUY            FRIDAY              TODAY
FDO (Family Dollar)                    $58.8193     gain   .68%            gain  1.72% SOLD
DLTR (Dollar Tree)                      $79.20         gain   .53%            gain  5.23%
CATM (Cardtronics ATMs)         $24.81          gain 9.42%            gain 10.11%

You will remember that in my last blog, I wrote that I wanted to sell FDO as soon as possible. It was always tepid, even though climbing some 7% in the past week, when it hit a particular price, it would fall back down. (this is called resistance) Some analyst believe that FDO is OVERBOUGHT. That means too many people own it and it is over-valued. This can be a learning lesson for me and you, in that, if a stock doesn't show MOMENTUM, get out of it! By the end of the day FDO closed with only a .31% gain. By following my intution and selling at the high during the day, my portfolio gained 1.72% .   The 1.72% gain is after brokerage fees, so I am happy that I didn't have a loss in my portfolio and have exceeded the amount I would have made from a Certificate of Deposit. (Excepting that it only took a month to gain the 1.72%)

AMAZING INVESTING FIGURES

Harry Markowitz is a Nobel Economics Prize winner and considered the "FATHER OF MODERN PORTFOLO THEORY".  As I understand it, his portfolio is divided into half, with 50% going into VTI (Vanguard Total Stock ETF) and 50% going into BND (which is the Vanguard Total Bond ETF). For a man who is so intelligent but has such a simple portfolio, one has to ask: "What does he know that I don't?"

In the past few blogs, I have explained why this market is different than any other. The last 12 years, the DOW has remained flat, growing only .83% annually and when offset by CPI (inflation) the DOW has declined. When considering that Financial Advisors have their clients into investments that DO NOT BEAT THE DOW INDEX and fall below the DOW index some 10%, 20%, even 30% it is no wonder that almost everyone's portfolio is beaten up.

USE CARE BEFORE PURCHASING AN ETF IN THE MARKOWITZ PORTFOLIO

Care should be used when entering the Markowitz Portfolio. Make sure that the current price of the ETF is ABOVE THE 200 DAY MOVING AVERAGE or don't buy it. If the ETF moves below the 200 day moving average, sell it! Re-purchase the ETF when it rises above the 200 day moving average.

I am presently invested in BND, but I have a stop-sell on the ETF just in case it start falling. Treat ETFs just like stocks. Don't buy a BOND CERTIFICATE. There are concerns that there is a BOND BUBBLE, so be cautious here. In this volatile season of the market, always protect yourself with a STOP-SELL. You will not regret it later.

(Note: the above article is soley for entertainment purposes and not to be used in anyway as financial advice.)